Electric trucks in India are attracting serious money. Manufacturers are launching new models, fleets are running pilots, and charging companies are planning networks. But a harder question lies beneath it all: where should that money go first?
Consider three diesel trucks: a construction tipper, a port tractor-trailer, and a city delivery truck. Although all three burn diesel, they don’t save the same emissions when they go electric. Nor do they suit an electric truck equally well. As a result, money placed in the wrong segment pays off late or not at all. So we built a data solution to answer the question, segment by segment.
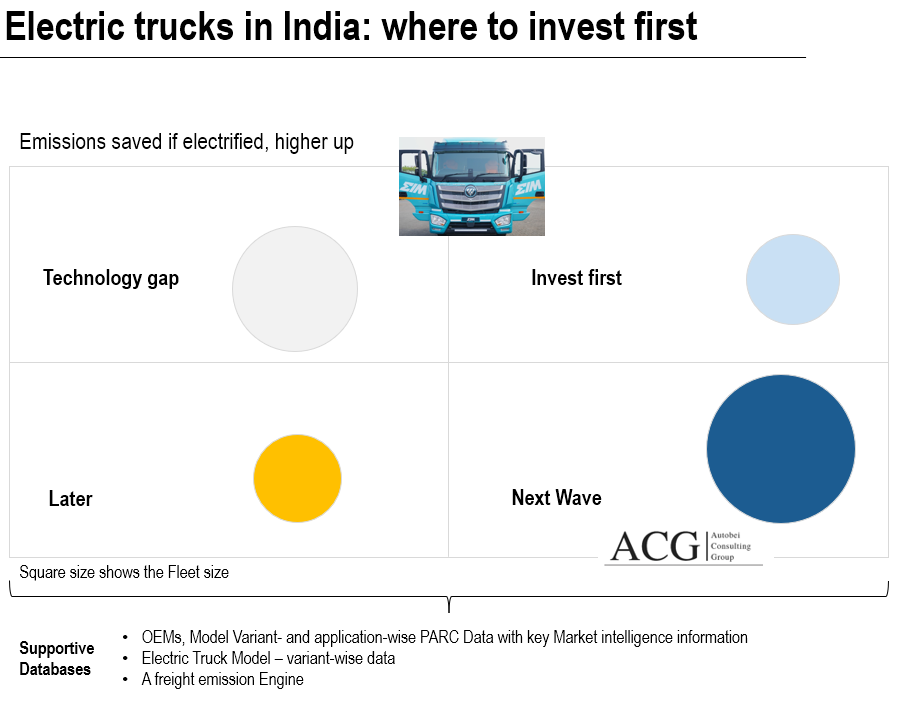
The problem: every piece leaves you hunting for the rest
Anyone trying to decide where to electrify trucks starts with one piece of the puzzle. Unfortunately, that piece never works alone.
- If you know the calculation method, such as ISO 14083 or the GLEC Framework, you can work out emissions per tonne-kilometre. But you still need to find which trucks are on the road, what work they do, and how they are loaded.
- If you have fleet (parc) data, you know how many trucks run in each segment. However, you then need to map each segment to its application, such as construction, port haulage or city delivery.
- If you know the applications, you understand the jobs trucks do. Even so, you must still map each job to real parameters like daily distance, payload, empty running and overload.
- If you have electric truck data, you can see battery size, range, and power. Yet without the other pieces, you can’t tell which diesel segments those models could replace.
In each case, you end up chasing the missing pieces, and then stitching them together by hand. As a result, many decisions rest on assumptions that fill the gaps. That is how investment ends up in the wrong segment.
Why averages lead investment astray
Most electrification talk relies on fleet-wide averages. Unfortunately, averages hide the real answer.
In fact, an electric truck’s return depends on four things. First, how far does it run each day? Second, how is it loaded? Third, which electricity grid does it charge from? Finally, does a suitable model even exist? A single national figure can’t capture any of that, but a segment-level view can.
What we built: one master solution
We connect all the pieces in a single, linked model. Because each part feeds the next, you don’t need to hunt for anything. Instead, you get a complete chain from the fleet on the road to a ranked decision.
- Diesel fleet (parc) data for India. It covers make, model, weight class, body type, axle configuration, engine, emission norm, vehicle count, and age.
- Application and load mapping. Each segment is linked to the work it does, with parameters such as daily distance, payload, and the share of distance driven empty, at rated payload and overloaded.
- A freight emissions engine. Following the logic of ISO 14083 and the GLEC Framework, it reports emissions per tonne-kilometre.
- Electric truck data. Models on sale in India are listed with battery size, claimed range, power, body type, and annual unit sales, and matched against each diesel segment.
Together, these parts turn separate facts into a decision tool. That is why we call it a master solution.
What the model tells you
Together, these sources answer five practical questions:
- Where is the emissions case strongest? Because we count empty running and overload, we don’t assume every truck runs full.
- How much does the grid matter? The same electric truck saves much more on a cleaner grid, so we test both.
- Which diesel trucks can be replaced today? For a match, an electric model must fit the body type, axle, payload, and daily range. In addition, the truck must be able to charge at a depot.
- Which segments come first? We rank them by emissions saved and by how practical the switch is.
- Where are the gaps? Some large diesel segments still have no suitable electric truck, which is an opening for manufacturers.
Every input can be changed. For example, distance, payload, energy use, grid factor, and fuel price all adjust, so the results fit your own operation.
How this differs from other tools
Most freight emissions tools give you one number for one trip. Meanwhile, EV trackers mostly tell you how many trucks were sold.
We connect the two. Starting with the diesel trucks that actually run on India’s roads, we then show what electrifying them would achieve. In our experience, few other approaches combine fleet detail, load profile, and emissions method around electric trucks.
Where this helps investors and decision-makers
Different players use the same data to place different bets.
- Truck manufacturers see where the emissions case is strongest and where no product exists, so they know where new models are needed.
- Fleet operators and logistics providers learn which routes suit electric trucks first. As a result, pilots go where they are most likely to work.
- Investors can test whether an electric logistics business’s claimed savings are realistic before committing capital.
- Charging and energy companies see which segments could create the largest charging demand, and therefore where to build first.
- Shippers get figures for Scope 3 transport reporting, plus a way to check carrier claims.
- Policymakers can target support at the segments that cut the most emissions.
- Consulting firms gain specialist EV truck depth without building it in-house.