EV Truck Analytics in India: Which Cities and RTOs Will Buy Electric Trucks Next?
EV truck analytics answers a simple question: where will the next electric trucks sell, and who will sell them?
We take a different route. At ACG (Autobei Consulting Group), we score more than 1,200 RTOs one by one and show who leads in each. Below are two charts from that work, and what they tell us.
Why RTO-wise EV truck analytics matters
National numbers hide local reality. India has hundreds of truck markets, and each one behaves differently. A city can be huge in diesel and silent in EV. Another can be small, yet already full of electric trucks.
An RTO is the local transport office where trucks are registered. When you read data at that level, you see three things clearly:
- How big the market is,
- Who leads and who is second,
- How far EV has already moved.
So the decisions get easier. Dealers know where to open. Charging companies know where to build. OEMs know where to launch. Investors see where demand will form first.
Where future demand is building
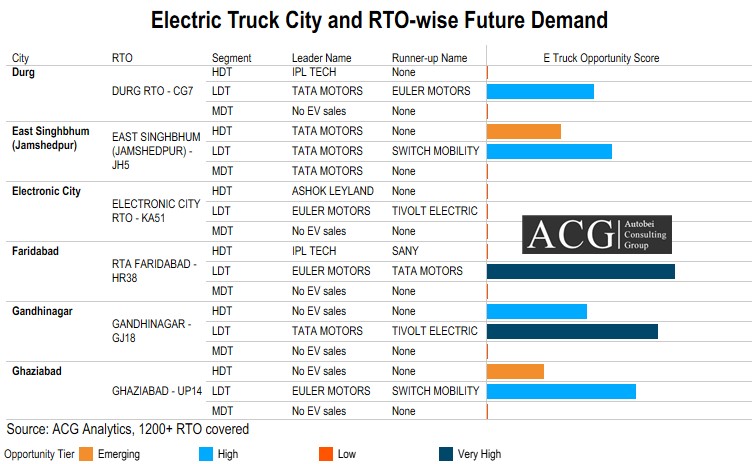
This chart gives each city and RTO an opportunity score for electric trucks. It splits the score by segment: HDT, LDT, and MDT. The colours show the tier, from Low to Very High.
Key Insights:
LDT leads the way. Faridabad and Gandhinagar reach the Very High tier in LDT. Durg, East Singhbhum, and Ghaziabad reach the High tier. Light trucks are clearly where EV demand is strongest in these six places.
Some markets are open fields. Gandhinagar and Ghaziabad show “No EV sales” in HDT, yet they still score. That means a large diesel market with no electric player yet. For a first mover, that is a real chance.
MDT is quiet. In these RTOs, medium trucks show little EV activity, and the scores stay low. It is a segment to watch, not to chase.
The competition changes from city to city. Euler Motors leads LDT in Electronic City, Faridabad and Ghaziabad. Tata Motors leads in Durg, East Singhbhum and Gandhinagar. Switch Mobility and Tivolt Electric appear as runners-up. In East Singhbhum HDT, Tata leads with no runner-up at all. That market has no rival yet.
The EV leader and the diesel leader are rarely the same brand
The second chart looks at one question. Who leads each RTO in EV, and who leads in ICE and other fuels? It shows trucks sold and the leader’s market share for January to September 2026.
The answer surprised many people we show it to. In five of the six RTOs, the EV leader and the ICE leader are different brands.
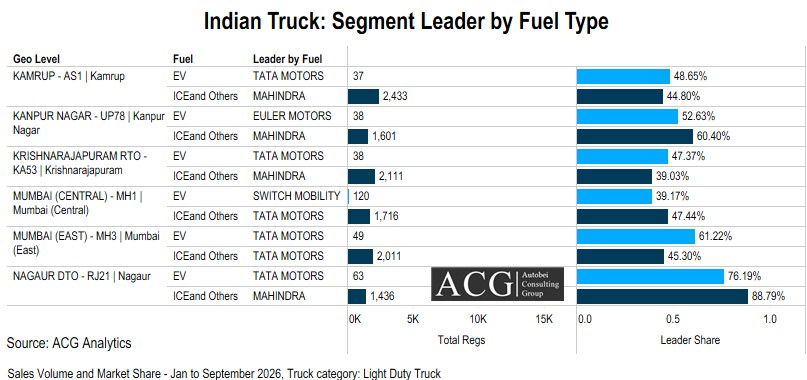
- Kamrup: Tata Motors leads EV with 37 trucks. Mahindra leads ICE with 2,433.
- Kanpur Nagar: Euler Motors leads EV with 38 trucks. Mahindra leads ICE with 1,601.
- Mumbai (Central): Switch Mobility leads EV with 120 trucks. Tata Motors leads ICE with 1,716.
- Mumbai (East): Tata Motors leads both.
Two more lessons come from the same chart.
First, the scale gap is huge. The ICE leader sells between 14 and 66 times more trucks than the EV leader in these places. EV is still early.
Second, a small base means a small win can change the lead. In Nagaur, Tata holds 76.19% of EV with 63 trucks. In Kanpur Nagar, Euler holds 52.63% with 38. A challenger does not need thousands of sales to take the top spot in EV. That is very different from the ICE market, where Mahindra holds 88.79% in Nagaur.
In short, a strong diesel position does not guarantee an EV position. Each fuel needs its own plan.
How to use EV truck analytics in your plan
Here is how different teams can put these charts to work.
- OEMs: pick launch cities where the score is High or Very High, and the leader is not yet strong.
- Dealers: place EV stock and demo trucks where EVs already sell and room remains.
- Charging companies: start where trucks and EVs meet, not where only the diesel volume is big.
- Investors: use the gap between today’s EV share and peer cities to size the headroom.
Complete solution or data only
We offer the complete solution. That means the interactive tool, the RTO-wise scoring, the leader and competitor view, and clear action tags for each RTO, such as defend, attack or enter. We also work with your team to turn the findings into a plan.
If you prefer, we also offer a data-only option. You get the RTO-wise data and use it in your own systems.