Application-Wise Truck PARC Data: The Missing Layer in India’s Truck Industry
There’s a well-known line at Autobei Consulting Group: no truck is good or bad. It depends on the application it works in.
We’ve extended that idea further. Now we connect technical specs with real usage patterns. This is the foundation of our Application-Wise Truck PARC Data.
A standard truck PARC database tells you one thing: how many trucks are on the road. Our data, however, goes deeper. It explains the actual structure of the Indian truck market.
Our Model and Application-wise Indian Truck PARC Data shows how trucks are really used. For instance, it covers load patterns, emission norms, running kilometres, and where demand is likely to grow. It also helps estimate replacement cycles and future fleet size. On top of that, we maintain RTO-wise PARC data for location-level detail.
Why Application-Wise PARC Data Is the Missing Layer
Registration numbers answer a basic question: how many trucks exist? That’s useful, but limited.
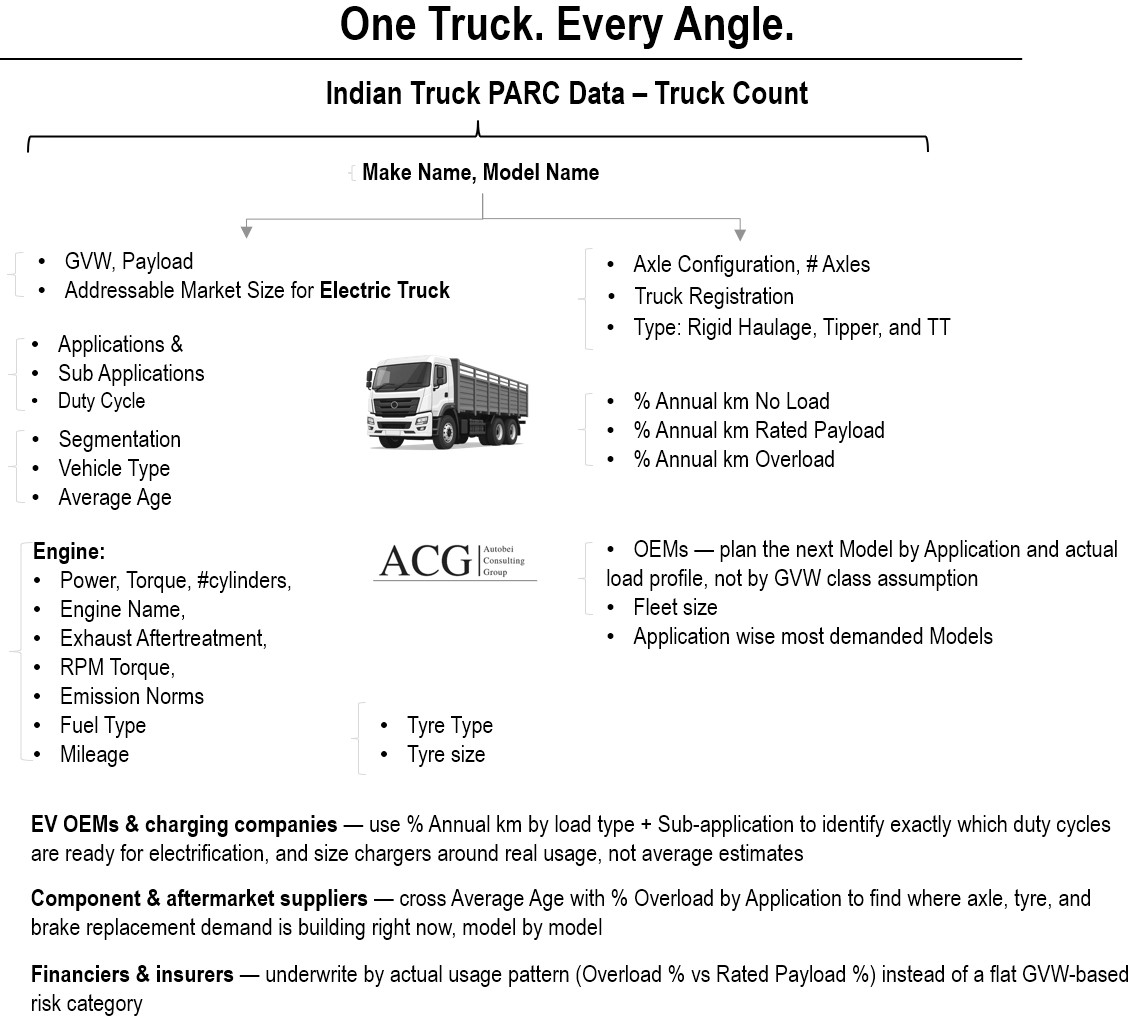
Application-wise data, in contrast, answers harder questions. It covers body type, axle configuration, duty cycle, load pattern, emission norm, and vehicle age. Together, these reveal three critical things:
- Where trucks are actually deployed, by application
- How each truck is being used day to day
- Where the next failure, replacement, or investment is likely to happen
For example, we track how many Rigid Haulage trucks serve vegetable transport. Similarly, we track Tractor Trailers in cement, and Tippers in mining. Then we map each group against technology, load pattern, and age. As a result, this gives a full view of the industry.
Most PARC datasets stop at registration counts by segment, tonnage, and OEM. Our data, meanwhile, adds application, specifications, age, aftertreatment, and load patterns. Because of this, a simple headcount becomes a working model of the truck market.
We Build a Decision Tool, Not Just a Dataset
Here’s the difference, in practice.
General PARC data says: 24,000 tippers are registered in Chitradurga.
Our application-wise view says: 2,000 of those are LPK 2518, 6×4 tippers. Each has a 25T GVW, roughly 15T payload, and 180hp. Most run mining duty. Average overload sits at 20–25%. Median age is 8 years. Most still run BS-IV with EGR only.
The first number is a statistic. The second is a strategic tool. For one thing, it shows where wear and tear will likely rise first. Which emission transition could trigger replacement demand next? That becomes visible too. Similarly, fatigue failure risk by component starts to show up clearly. Even the need for a new dealer or service point becomes easier to spot.
Without this context, judging the current market — or predicting where it’s headed — becomes guesswork. With it, however, OEMs can plan dealer networks more precisely. They can also factor in driver comfort, operating costs, and expected parts consumption.
How Each Data Layer Adds Value
- GVW and payload are usually just brochure numbers. But knowing which model runs which application, at what load, unlocks something more useful: a predictive view of maintenance needs and truck lifespan.
- Exhaust and emission norms, meanwhile, show how many truck models, across each application, are due for replacement next.
- Vehicle age alone rarely drives a decision. One exception: a 15-year-old truck can’t legally operate in Delhi. Beyond that single rule, age only becomes powerful when combined with application data. Together, they help predict aftermarket service demand and guide new model planning.
- Overload, underload, rated payload, and no-load running, combined, predict truck replacement timing. Add application data to the mix, and operating costs — fuel use, axle wear, tyre cost — become predictable too.
This same combination answers other pressing questions. How many trucks still run BS-IV versus BS-VI, by application and age? What will the fleet look like by 2030? How many trucks will remain in operation five years from now? And which applications offer the strongest growth potential for electric, LNG, or CNG trucks?
Who Benefits From This Data
OEMs, including EV OEMs — Design trucks for specific applications, not broad segments. This is how you actually win the customer.
Suppliers — Tyre, clutch, oil, axle, and brake manufacturers benefit most. Combining load pattern with application gives a precise read on wear status and part replacement timing.