Electric Car Report Store is a one-stop solution for Electric Car start-ups, Entrepreneurs, Investors, OEMs, Suppliers, Market Research firms, SDV, and other service providers. ACG has key expertise in Electric car Products, Sales, Pricing, Entry Strategy, Customer Analytics, and Feasibility Studies of EVs and Components.

USA India and Europe Electric Car report package

The Electric car package is a Master report package for OEMs, Venture Capital, Start-ups, Research firms,  and Component suppliers. We prepared this package because it covers or touches every major business arm of the Electric car Business.Electric car various report

We created this exclusive Electric Car package so the client can get a 360-degree view of customer behaviour to the component-level supply chain value chain. The report bundle provides insight into how different EV verticals connect and how to use this information for EV business in Europe, India, and the USA.

The bundle report is affordable compared to buying individual EV reports. Purchasing a single package means making faster strategic decisions, as all EV market Intelligence is consolidated.

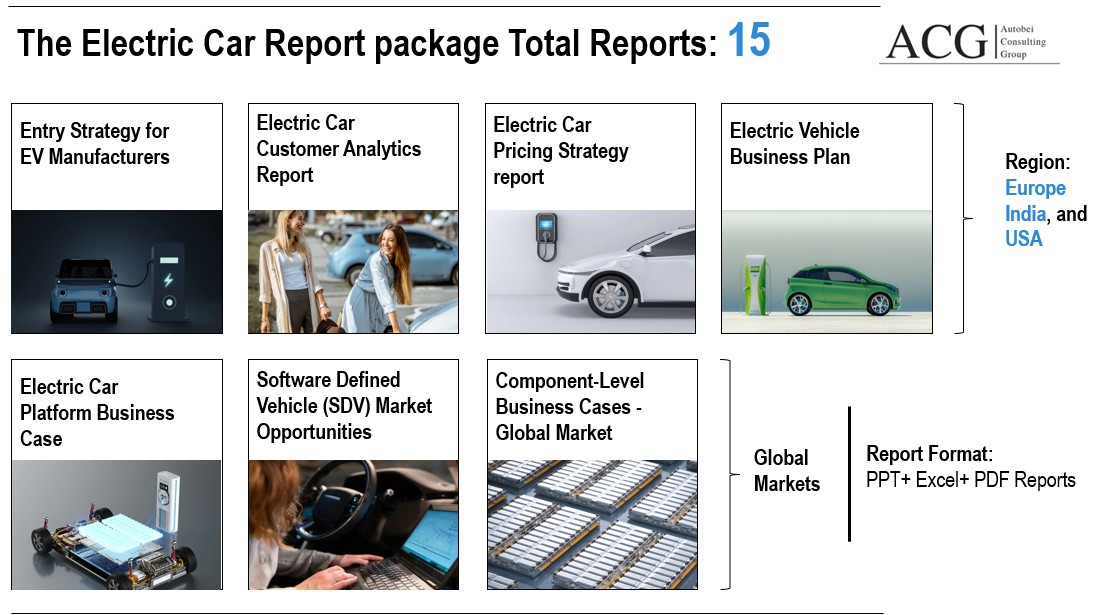
A total of 15 reports are available under this package:Electric Car Market Intelligence package for USA India and Europe

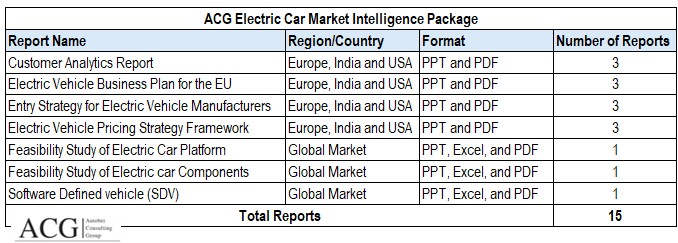
In this package of Electric Car reports, we have covered the Demand side (Customer Analytics, Pricing Strategy, Business Plan) and the supply side, such as the EV component business case.

Our EV package also covers a 360-degree view of the Electric car supply and value chain from end user to OEM business strategy and drills down to EV ecosystem component supply.

The EU, the USA, and India are among the Key markets for Electric cars.  We are offering key reports and a Feasibility Study in a single bundle:

The following are the reports available under this EV Package: Total Reports 15

Electric Car Market & Strategy

EV report Europe USA, and India

European Region Electric Car Report Package:

    1. Customer Analytics Report – 
      • Number of Pages: 60
      • Format: PPT and PDF
    2. Electric Vehicle Business Plan for the EU
      • Number of Pages: 60
      • Format: PPT and PDF
    3. Entry Strategy for Electric Vehicle Manufacturers 
      • Number of Pages: 97
      • Format: PPT and PDF
    4. Electric Vehicle Pricing Strategy Framework 
      • Number of Pages: 130
      • Format: PPT and PDF

Indian Electric Car Report Package:

    1. Customer Analytics Report
      • Number of Pages: 55
      • Format: PPT and PDF
    2. Electric Vehicle Business Plan for India
      • Number of Pages: 97
      • Format: PPT and PDF
    3. Entry Strategy for Electric Vehicle Manufacturers 
      • Number of Pages: 110
      • Format: PPT and PDF
    4. Electric Vehicle Pricing Strategy Framework 
      • Number of Pages: 95
      • Format: PPT and PDF

USA Electric Car Report Package:

    1. Customer Analytics Report
      • Number of Pages: 51
      • Format: PPT and PDF
    2. Electric Vehicle Business Plan for India
      • Number of Pages: 106
      • Format: PPT and PDF
    3. Entry Strategy for Electric Vehicle Manufacturers 
      • Number of Pages: 178
      • Format: PPT and PDF
    4. Electric Vehicle Pricing Strategy Framework 
      • Number of Pages: 88
      • Format: PPT and PDF

Technology and Platform

Feasibility Study of Electric Car Platform:

    • Number of Pages: 324
    • Format: PPT, Excel, and PDF

Software Defined Vehicle (SDV) Opportunities:

    • Number of Pages: 312
    • Format: PPT, Excel, and PDF

Electric Car Component level Business cases

Feasibility Study of Electric car Components:

  • Battery System
  • Power Electronics
  • Electric Motors
  • Charging Systems
  • Infotainment and Connectivity Systems
  • Safety Systems and ADAS
  • Thermal Management System
    • Number of Pages: 178
    • Format: PPT, Excel, and PDF

Various EV report advantage’s: USA, EU and India

  • Customer analytics– Help Understand customer buying pattern, expectations, Preferences, and Price elasticity of the Electric Car in USA, EU, and India.
  • Pricing and GTM Report: Roadmap for Entry Strategy, Positing, Product strategy, brand Strategy, Price point, Product portfolio, EV factory setup cost, and Revenue or ROI analysis
  • EV Business Plan: Key document for investor, ROI, Forecast, and Blueprint for Electric car business in USA, EU, and India
  • EV components Business case: Opportunities Analysis of supply chain ( Battery, Power Module, Motor)
  • Electric car Platform Business case:  About long term planning, Feasibility, Scaling, and R&D.
  • Software defined vehicle (SDV): Opportunities and market demand analysis for Global SDV suppliers

Other advantages of Electric car package reports:

  • ACG Electric car package or bundle reports provide ready made dossier for pitching to Venture capitals, Banks or Policy maker to take quick decision.
  • Covered both commercial and technical aspects of the Electric car business.
  • Mostly the individual reports does not align with other aspects like buying only pricing report does not align with the customer analytics, or Business plan.

Contact at info@autobei.com to get the detailed of the Table of Content of the each report

The Feasibility Study on Electric Vehicle Dealerships has two parts:

  1. Convert the existing Electric Vehicle dealership into a profitable one, and
  2. A roadmap for a new dealership to make it profitable.

EV Dealership Profitability

Operating an Electric vehicle dealership is challenging because the cost structure, revenue sources, Customer behavior, and Sales Volume differ from those of a traditional ICE dealership. The Dealership in the Automotive Industry is the backbone of the Business.

The following categories are defined under the Electric Vehicle dealership feasibility Study:

  • Electric Car
  • Electric Two Wheeler
  • Electric Three Wheeler
  • Electric Truck and Bus

Like ICE vehicles, Electric vehicles have a different business model. They do not have a regular revenue source from after-sales. However, they also do not need a heavy investment and a large area to build the dealership. EV dealerships focus on additional services for customers that no one else traditionally offers.

ACG assists in identifying a strategic location that attracts the maximum number of potential buyers, not just footfall. Our New approach to electric vehicle Dealership feasibility gives high ROI.

Additionally, we support Manpower training, Cost savings, High productivity, Customer pain points, Customer experience, Touch points, Monthly market updates, Marketing Plans, and Competitor scenarios.

Manpower’s communication skills, knowledge about EV technology, and Satisfactory answers to customers’ queries are the keys to closing the deal. During our survey between November 2024 and June 2025, many incidents were observed in which salespersons were completely unaware of EV technology when buyers asked beyond the fundamental question. Only pitching the vehicle with a running cost of 1 Rs per km no longer works.

Contact us to know more about it.

The Indian Electric Light Commercial Vehicle market report (111 pages) is highly attractive due to its favourable TCO, limited daily run, attractive price point, Suitability for various applications, and availability in different Models by multiple OEMs.

Indian fleet owners have a clear mindset when calculating their benefits by adding the Indian Electric Light Commercial Vehicle to their portfolio. As per the ACG survey, single, small, medium, and large fleet owners know the electric CV models and their advantages and challenges. We have also included the three-wheeler segment in this report.

Electric Light passenger Commercial vehicles do not have a wide range of models because of the high upfront cost and the suitability of various applications. OEMs need to launch new products in this segment. The Three Wheeler Electric Vehicle has higher numbers than the 4 Wheeler EV LCV.

Case Study: Economy (TCO) of the Electric Truck: 

The application of Trucks and Buses is the key to this Industry. Application-wise Truck and Bus Sales Data is the backbone of the Indian Electric Light Commercial vehicle market. ACG’s unique database provides key insight into the market scenario, product planning, pricing, TCO, features, and business strategy.

We have done several studies on the feasibility of Electric Commercial Vehicles, including the study.

Application-wise TCO Analysis

Food Grain Transport Application: If the Electric Truck user installs the solar roof at his office or home and charges the truck, then the payback period is 1.5 to 2.5 years, and without a solar panel, it is 3 to 3.5 years.

Milk Collection and Distribution: We have considered two scenarios for Milk distribution with and without government subsidy. The payback period without subsidy is ~ 2 to 2.5 years; with subsidy, it is 1.8 to 1.5 years. The detailed TCO is available in the full report.

We have covered all key applications with the sales forecast for 2030.

Competitive Landscape:

Tata Motors is aggressive in promoting its Electric Tata ACE.  Tata has competitive advantages because Tata ACE is a well-known Product brand in the buyer’s mind. Its price point is also attractive, starting from 3.99 lakhs.

Pricing Analysis Electric Truck and 3W Cargo
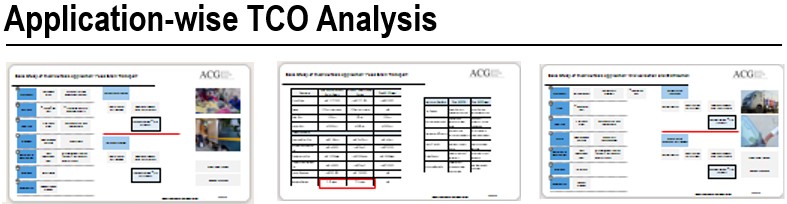
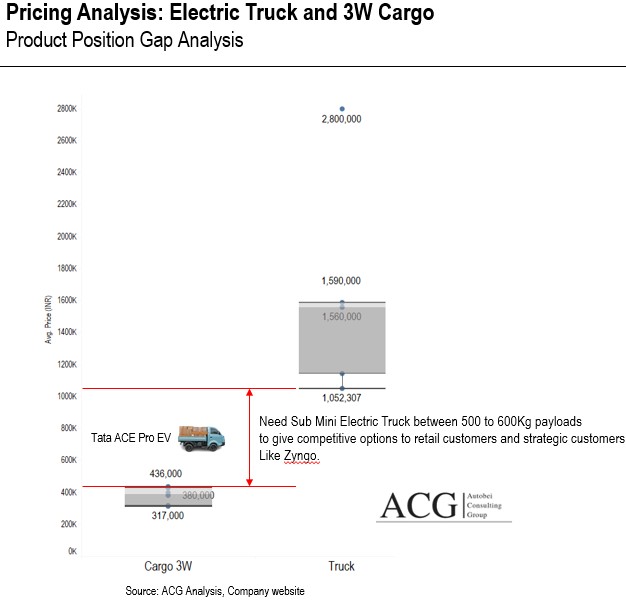
This is the most attractive price design for a specific application of short-distance distribution. The Tata ACE PRO payload is 750T, the LFP battery size is 14.4 kWh, and the real range is 130 km. Other Tata ACE EV products are the Tata Intra EV and Tata ACE EV 1000. The company is promoting heavily on digital platforms.

Electric LCV Competitive Landscape

Euler Motor also entered into a 4W Small Electric Truck from Electric 3W. Euler has an Electric 3W, Electric 4Wheeler cargo and Passenger. This combination covers various customer segments. The Euler Motore price band starts from 4.4 to 14.5 lakhs.

EKA has a rich portfolio because it tries to fulfill the requirements for various fleet owner types and Truck Applications. It has an ideal commercial vehicle portfolio, including electric three-wheelers, buses, and trucks. EKA has a 55T Tractor Trailer, an EKA 1.5T, an EKA 7T, and one EV 3-wheeler model.

Eicher is lagging in electric commercial vehicles (EV CVs) because it lacks a wide product portfolio. Currently, it has only one EV truck, the Pro 2055 EV.

SwitchMobility has Two Small Electric trucks, SWITCH IeV3 and SWITCH IeV4, on the SWITCH IeV Series platform. SWITCH IeV3 has a 1.25T Payload, 140 km range, and a 25.6kWh battery size. SWITCH IeV4 has a higher payload, 1.75T capacity than IeV3, 130 km range, and a 32.2kWh battery size. SwitchMobility needs to work on its network strategy for the Small EV Truck.

Other players, such as Omega Seiki Mobility and Mahindra, are also trying to establish their presence effectively.

Key Driver:

The Indian government started supporting electric commercial vehicles to save oil import bills and to manufacture environmentally friendly Commercial vehicles. The EV CV will be in top gear by 2030 because of low operating and maintenance costs, Subsidiary, High productivity, low fatigue, decreased battery price, Vehicle Digital features, and Green energy.

Electric LCV Applications:

Contact us to get the data on the high-growth Electric Vehicle applications.

Application-wise Electric and ICE Truck Sales Forecast

Customer Voice:

Capturing customer voice is one of the essential activities in preparing this report because it helps to understand customer expectations and challenges, as well as their sales plan. Electric commercial vehicle customers are categorised into urban and Rural areas. Both have different buying decision trees, Awareness, market dynamics, and Applications.

Customer Voice – Different applications – Rural and Urban

Key Challenges:

Potential buyers of electric commercial vehicles are still struggling because there are fewer models available, charging infrastructure is lacking, supply chain constraints of EV components are high, upfront costs are high, and there are myths about the technology.

Key highlights of the Report and Data -111 Pages:

  • Indian Electric Commercial Vehicle Market Assessment and Forecast 2030
  • On various parameters, the market attractiveness study
  • Market size of Electric and ICE-powered train vehicles
  • Competitor Analysis
  • High Demand and Suitable Application-wise Electric LCV Sales Forecast
  • Electric LCV Product Specs requirements for various applications
  • Region-wise -North, West, East, and North region demand analysis
  • Pricing and Branding Strategy
  • Customer Voice survey
  • Willingness to pay analysis of Electric LCV
  • Fleet owner analysis

India’s two-wheeler tyres had the most significant 20% share of Tyre units in the Indian Automotive Tyre segment in FY 2025. This 20% tyre Two-Wheeler Market Share is double compared to FY 2021. The Indian Two-Wheeler tyre market was valued at 2.85 billion USD in FY 2025 and is expected to reach 5.5 billion USD by FY 2030. A 13.9% CAGR will likely be registered from FY 2025 to FY 2030.

The Indian two-wheeler tyre market was 123.5 million units in FY 2025, and this segment has the largest share in the Indian tyre industry. The motorcycle segment is the largest in the Indian Two-Wheeler Tyre market, but the Scooter segment is also growing fast. The key reason behind this is the small replacement cycle of the motorcycle segment and the large number of motorcycle units parked in India.

The replacement tyre is smaller in rural India than in Urban areas because of rough terrain in rural areas and more use of motorcycles.

Indian Two Wheeler Tire data and report

Types of Tyres:

Radial tyres are still not popular in the Indian Motorcycle and Scooter segment. However, motorcycles above 300cc prefer to have radial tyres. Radial tyres are a bit more expensive than bias tyres. The difference in price between Bias and Radial is around 500 to 900 INR.

Motorcycles have a significant share compared to Scooters and mopeds. Tyre Buyers have different purchase patterns. In the South, 53% of customers have a specific brand in mind before buying the tyre, which differs in other parts of India. North, East, and West India have different buying habits for tyres for their Two-Wheelers.

The Indian tyre market is significant in the 80/100-18 M, 90/90X17, 100/90-17, and 100/80-17 sizes. Electric Scooters have popular tyre sizes 100/80-12, 90/90-12, and 110/70-12. We provide the Tyre size-wise Market size, OE, and the replacement tyre market. We have included more than 30 types of tyre sizes.

Competitor Landscape:

MAXXIS, MRF, TVS, and CEAT are the major brands in the Indian two-wheeler OE and replacement market. MRF and CEAT are leading tyre brands because they provide better value for money. Independent or multi-brand Tyre dealers also promote these two brands. Michelin offers premium tyres at almost double the price of mass market tyres. The company must convince the buyers of the value of high-end premium tyres. During the ACG survey, we also observed that even after communicating the key features of the premium tyre, buyers could not connect with those points without experience.

TVS has benefits, such as a wide range of two-wheelers in India, especially for the OE tyre market.

  • MRF Tyre
  • Apollo Tyres
  • CEAT Tyre
  • JK Tyre
  • TVS Srichakra Tyre
  • Bridgestone Tyre
  • Michelin Tyre

The Growth Drivers of the Tyre market:

In FY 2025, 23.9 million two-wheelers were produced in India. According to the ACG forecast, the Indian Two-Wheeler market is expected to register a 0.5% CAGR from FY 2025 to FY 2030.

The Key drivers behind the growth of the Indian two-wheeler market are:

  • Quick commerce growth
  • This effective mode of transport to avoid traffic congestion in cities like Mumbai, Delhi, Pune, Bangalore, Ahmedabad, and other Metro, Tier 1, and 2 cities
  • Affordable price point of 60% motorcycles, Scooters, and mopeds
  • Growth in Electric scooters included slow EV
  • Better resale value, long life cycle of the Vehicle, and low maintenance cost
  • A rich product portfolio means buyers have many choices that fulfill their needs.

State-level Two-Wheeler Tyre market:

North India is the largest market for replacement and OE tyres. Uttar Pradesh is the central state in the North region. In UP, two-wheelers are popular because buyers are looking for the most affordable mode of transportation in daily life. Industry collaboration and culture play a role in making it the largest Two-Wheeler market in India. The Rural areas in UP prefer to have a Motorcycle for day work.

In the western region of India, MP, Maharashtra, and Gujarat are the central states for motorcycles and scooters. Electric Scooters are also popular in these states and are expected to be one of the significant markets for 2W EVs.

In South India, Bengaluru and Chennai are the major cities. Q commerce is also one of the primary reasons behind the attractive tyre replacement market. However, the buyers’ behaviour differs in Bagaluru from that in other parts of India.

Delhi, Rajasthan, Bihar, and West Bengal are the other significant two-wheeler tire markets.

Challenges and Opportunities:

The large market size is attractive to tyre manufacturers. ACG has conducted extensive research to identify buyers in the secondary tyre market. As per our study, it is a challenge that buyers do not process all the technical and complex information related to a tyre before making a decision. However, this is also considered an opportunity to gain a significant share of this segment.

Make the tyre brand Strong and Appealing:

Need to design an effective Brand Strategy to engage the potential and existing buyers. The brand needs to be energized, which impacts the buyer’s decision. This can be done in the following ways:

  • Innovative product communication
  • Engage your buyers in pre-sales and post-sales

The Tyre brand can be interesting to buyers in the above two ways.

ACG has created the Brand matrix with the customer (Tyre buyers) on the following parameters:

  • Tyre Brand equity,
  • Tyre Brand relevance,
  • Tyre Brand image,
  • Tyre Brand loyalty, and
  • Tyre Brand portfolio

In today’s world, the above five parameters are changing rapidly, and Tyre’s brand needs to keep up with how customers perceive it and process information.

Key Highlights of the Report:

  • Indian Two-Wheeler Market Assessment
  • Indian Two-Wheeler Tyre Domestic Market Size, Import Tyre, and Export Tyre Market
  • Motorcycle, Scooter, Moped split between ICE and EV drivetrain
  • Tyre size-wise Market share, Sales by units, and Sales by Value
  • Indian Two-Wheeler Tyre Market trend and forecast – FY 2020 to FY 2030
  • Customer Buying behaviour Analysis and survey
  • Replacement interval of the Motorcycle and Scooter
  • Brand and Sales Strategy Analysis of Tyre Manufacturers
  • Price point of the various tyre size

The Indian Two-Wheeler Market has more than 300 variants. Around 90% of sales are from the model variants with a price below 150000 INR. Only 7 Models have a 50% market share in FY 2025. The other 125 models have a balanced 50% market share.

The product is the core of the Indian Two-Wheeler Industry. For buyers, a Motorcycle or Scooter is not just a physical product but a combination of Service, Aesthetic look, Parts, Durability, Reliability, Brand image, Experience, Technology, organization, and others. The successful product strategy has all the essential components and ingredients.

This report analysed how customers buy the motorcycle or scooter they want. Two-wheeler buyers estimate which Motorcycle or Scooter will deliver the most perceived value and act on it. Whether the Product offer lives up to expectations affects customer satisfaction and the probability that the customer either repurchases or recommends it, such as Splendor and Activa.

What benefits are buyers getting, and what is the cost? Here, the price refers to the bundle cost, such as buyers’ time, energy, psychological cost, etc.

Buyers want a certain level of reliability, durability, performance, and resale value. A certain level is a relative term directly associated with product cost or customer segmentation.

Indian Consumer Income Group 2030

Buying Pattern Analysis:

Like school-going students (16- 18 years), the parents of young riders focus more on Safety, so they prefer a low-speed Electric Scooter.

Budget-conscious, college-going, or early job seekers prefer mileage-focused scooters and motorcycles. Young Professionals value Style and ValuePlus Motorcycles and Scooters. The 30 to 40-year-old age group looks for a multipurpose, stylish, or luxury Motorcycle.

Indian Two Wheeler Buying behaviour Analysis

Motorcycle Segment:

The segment’s market share up to 125cc declined to 75% in FY 2025 from 81% in FY 2012. 28% of model variants are available in this segment. The market share of the 125cc to 200cc segment was 15% in FY 2025 compared to 17% in FY 2012. 35% of model variants are available in this segment because they are growing. The segment above 2cc increased its market share from 2% in FY 2012 to 10% in FY 2025. 38% of motorcycle models and variants are available in this segment because buyers prefer a wide range of products.

Scooter Segment:

110cc and 125cc and above are two key segments. Most 125 and above scooters are owned by young people who like to have power. The 125cc segment is popular among Women, Middle-Aged people, and retirees.

Growing Preference for High-CC Bikes by FY 2025

125cc is the largest and dominant segment but market share is declining because buyers are looking for bit higher cc engine.

200 to 500cc is profitable segment. 500c and above is the growing Two Wheeler segment from FY 2021 to FY 2025.

Engine cc wise Indian Two Wheeler Segment Analysis

Why is 125cc the popular segment?

Mileage and Power are two key components of a Two-Wheeler. Buyers looking for mileage go below 125cc, and buyers looking for power go above 125cc engines. The 125cc engine segment offers a balance of power and mileage. This is one of the key drivers behind the largest segment in Indian Two-Wheelers.

Indian Two Wheeler Brand wise Product Strategy

Honda Product Strategy:

Consumers widely prefer Activa due to its Good Initial Acceleration, Smooth riding, Excellent suspension, Excellent riding Comfort, Moderate mileage, and Low maintenance cost.

DIO was introduced in the Indian market to attract the younger generations, which added to its sales volume.

First, introduce the “COMBI BRAKING SYSTEM” before it became Mandatory for all 2-wheelers. We were the first 2-wheeler company to introduce OBD Versions in India.

Honda has started frequently offering modified versions, such as 3G, 4G, 6G, Activa 125, OBD1, OBD2, and X Smart ( where no key is required to lock and unlock the vehicle, like in Cars).

Separate showroom and service set for high-end models to attract premium customers.

First to start “Smart Workshops” across India. It is the next level of  “Customer care” offered by Honda.

4 Models of Honda contribute 84% sales within Honda group including Activa 125 and Activa 6G in FY 2025. The product portfolio covers both Motorcycle and Scooter segment. Such market share have a more stable and reached to diversified customer segments. Honda has a significant presence in all two major segment ValuePlus and Economy.

Hero MotoCorp Product Strategy:

Though the HONDA Active and HERO Pleasure share the same Engine design and components, Pleasure cannot compete with ACTIVA due to some Quality issues and Riding comfort.

Though the Engine Design is the same, they lag in other Parameters.
Other scooter models introduced by HERO did not live up to the expectations of the Consumers.

In Motorcycles, Splendor is still the Single Largest selling Brand in India due to its incomparable Engine design ( Horizontal Engine: has its advantage) and vehicle Body geometry.

Also, the Introduction of “HF Deluxe” models (Which Share the same engine as Splendor) adds to their volumes.

The Splendor and HF Deluxe contributed 75% sales of Hero MotoCorp in FY 2025. This is highly risk business scenario. There should be diversification of product portfolio to cover wide range of the customer group. Both Models are in position in Economy Motorcycle segment.

Other Motorcycle Models Introduced by HERO initially received a good market response but could not sustain it in the long run.

Yamaha Product Strategy:

A late entrant to the Low CC Vehicles market, Honda, Hero, and TVS could not sustain in Volume games, though they provide good-quality products like RAY Z, ALPHA, and Fascino.

Now, they are moving away from low-CC vehicles and will focus on higher-end Bikes and Scooters in the future.

OEMs with Higher Sales Offer Slightly More Variants:

The relationship between the number of variants and sales is weak. Sales have a minor impact if the number of variants increases for every model. However, the results differed after developing a product strategy for individual brands.

Relationship between Indian Two Wheeler Sales and number of variants

Increasing the number of variants alone does not help OEMs increase sales; proper planning and a strategic target customer group are also crucial. Product features, Pricing, Brand Strategy, Customer segment, etc., also play a significant role.

Indian Two Wheeler Brandwise Variants

Sales Sensitivity to Performance Matrix Varies by Price Segment:

ACG performance helps to create Product Strategy and Product planning with Specs.

Higher-end or luxury segment customer buyers seek engine power relative to price. The economy segment harms increasing performance. Other important factors for the Economy segment are Price, Mileage, Brand Reliability, and others key specs.

Performance to Price ratio impact on Indian Two Wheeler Sales

In the ValuePlus segment, the performance matrix influences buyers’ decisions, but aesthetic look, features, and brand image also play essential roles.

Strong Linear Relationship Between Price and Kerb Weight

The Entry level Two Wheeler have a low kerb weight. This also help to get desired mileage. The higher priced Two Wheeler have a strong chassis, Heavy Engines, mostly with premium quality material.

Strong Linear Relationship Between Price and Kerb Weight

Table of Content of the report: Data in Excel is also available

  • Indian Two Wheeler Market Trend and Forecast in Units and Value (USD)
  • Vehicle Type: Motorcycle and Scooter
  • Model and Variants level Sales, Price, Kerb Weight (Kg), Engine Type, Number of Valves, Power (hp), Torque (Nm),  Transmission, Front  and Rear Break,  Front Tyre, Features, and other key detail.
  • Competitor Landscape: APRILLA, ATHER, Bajaj Auto, Harley Davidson, Hero, Honda, Husqvarma, Kawasaki, KTM, Okinawa, OLA, Royal Enfield, Suzuki, Triumph, TVS Motors, Vespa, and Yamaha
  • Segment: Economy, ValuePlus, Stylish, and Luxury
  • Engine Based Segment: Entry level, Executive, High performance, LifeStyle, and Power Bike
  • Customer Buying Analysis: Based on Gender, and Age
  • Sales and Market Share: North, East, West, and South Zone
  • Top 50 cities for 2 Wheeler Market
  • Motorcycle and Scooter Product Management: Product position, Value delivery by Top Models, Product Strategy, and Product Market fit
  • After Sales service cost analysis , Resale value
  • Electric Two Wheeler and ICE Engine Market Analytics
  • Brand Image and Position and how it impacts on Sales
  • Customer buying journey and different touch points experience
  • Customer segmentation based on income

The Indian Two-Wheeler Pricing Strategy report provides key insight into the different pricing dynamics of the Indian Two-Wheeler Industry.

In FY 20205, 50% of motorcycles and scooters will be priced between INR 90K and INR 189K. This segment accounts for 31% of total two-wheeler sales.

Bajaj Auto and TVS Motor control 50% of sales in this price band because their most popular Models, like TVS Motor’s Pulsar and Raider 125, fall within this price band. Sales prices above INR 189K and below INR 90K are controlled by Hero and Honda, which account for 70% of sales.

Low prices mainly drive Indian Two-Wheeler sales because most buyers are first-time buyers, and most first-time buyers consider whether a scooter or motorcycle is affordable.

Indian Two Wheeler sales and price analysis

As per the Indian Two-Wheeler Pricing Strategy report, Half of the Two-Wheeler Models are priced below INR 130K, and the rest are priced 50% above INR 130 K.

Indian Two-Wheeler Pricing Strategy

TVS Motors, Hero MotoCorp, and Bajaj Auto focus on the low-price segment to gain significant market share. Yamaha is also following the same line to compete in this segment.

Honda has a mixed product portfolio with an extensive price range to cater to multiple customer segments.

Indian scooter and Motorcycle Price range

Willingness to Pay:

After interacting with various buyer profiles, we have concluded that buyers are willing to pay higher prices for specific Models and variants because they are getting value for their money.

Honda’s Shine, Stylish Model is the Royal Enfield New Himalayan 450, Ola, TVS Apache,  Jupiter, and Yamaha Ray. The buyers are ready to pay more because they have experienced getting more against what they are paying.

Buyers are willing to pay more because it demonstrates appropriate product-market fit.

Willingness to pay for Scooter and Motorcycle

Value Segment is an attractive segment, based on Value (INR, Billions):

The scooter segment is moving towards ValuePlus because buyers are looking for value, not just low prices.

Market size of Indian Motorcycle and Scooter by Value

Indian Two-Wheeler Segment and Brand Market Share Assessment

The economy or the Affordable segment is shrinking, but ValuePlus and Stylish are growing. By 2030, the ValuePlus segment is expected to be the largest in value.

Royal Enfield is a highly profitable OEM because of its Product market fit in the Stylish, Value-plus, and Luxury segments.

Honda can penetrate the ValuePlus segment and increase its market share by 2030.

Indian Two Wheeler Pricing Segment Market Share 2025

EV scooters like Ola and Ather are present in the ValuePlus and Stylish segments.

To buy the Full report, contact us at Info@autobei.com

The Indian two-wheeler market reached 19.1 million units and a value of USD 21.141 billion in FY 2025. The industry grew by 7% CAGR from FY 2021 to FY 2025, excluding Electric 2W. The scooter segment showed a 13% CAGR, and the motorcycle segment had a 5% CAGR from FY 2021 to FY 2025.

Indian Two Wheeler Market Trend 2025

The Indian Scooter and motorcycle market is growing because scooters and motorcycles are affordable, have low running costs, require little upfront investment, have low EMIs, are in Demand in quick commerce, are easy to drive in heavy traffic, especially during peak hours, and are easy to park.

Entry-Level Bikes Remain Dominant in Indian Two-Wheeler Market:

The entry-level segment will still be the largest in the Indian two-wheeler market in FY 2025 because first-time buyers are price-sensitive. Other reasons are that entry-level two-wheelers have attractive mileage, are preferred in the rural market, and have low maintenance costs.

Due to increased disposable income and the primary commute vehicle, second-time buyers prefer executive and Lifestyle Motorcycles.

Indian Two wheeler Segment Trend 2025

Royal Enfield is the market leader in the LifeStyle segment because its brand is strong in buyers’ minds.

Indian Two-Wheeler Trends FY 2025: Honda Leads, Hero Slips:

Honda’s vehicle sales revenue overtook Hero MotorCorp’s Sales revenue in FY 2025. This is one of the milestones that Honda Two Wheeler India achieved. Honda achieved this because it has a mixed product portfolio. Honda has a significant presence in the Value Plus segment, and Hero has a stronghold in the Economy segment.

Honda overtake Hero in Vehicle Sales in 2025

Market Share Trend FY 2021 to FY 20205:

Hero has continuously lost market share since FY 2009, when its share was 60%. In the last 16 years, it has lost around 50%, down to 29% in FY 2024. Honda, which had a market share of 6% in FY 2009, has reached a 28% market share.

TVS Motors, Yamaha, and Royal Enfield increased market share because they adopted different strategies to win buyers’ confidence.

Indian Two Wheeler Brand wise Market Share 2025

Competitor Landscape: Motorcycle and Scooter

Honda is gaining market share and growth in the Motorcycle and Scooter segments because the company does not compromise on component or part quality, Production process, or Equipment quality.

Honda also sets a benchmark in the Industry in after-sales support by providing proper training to technicians, supply chain management, quality checks, and customer satisfaction.

Indian Two Wheeler competitor Analysis FY 20205

The other reasons are that Honda has high product reliability, performance, and resale value.

Indian Car Product Strategy is the backbone of success in the Indian Car, SUV, MUV, and Van segments.

Launching New models can significantly impact sales. In 2024, 29% of SUV Models were newly launched, 22% of MUV Models were newly launched, and only 11% of car Models were newly launched. Compared to 2014, new launches increased in 2024 due to rapid changes in customer expectations, Technological Upgradation, infotainment, and the rising spending power of buyers.

Our Product Matrix provides key insight into how Car Brands are present in each segment and how to make it effective.

Models presence in Indian Passenger Vehicle segment

In the Indian Car Product Strategy, the following points will be covered:

  • Current Product Portfolio and which product needs to be developed in the short and long term
  • What are the Market segment, their characteristics, and which market segment need to be focused on
  • How to differentiate the product
  • Current pricing position and future trend
  • Assessment of buyers’ needs
  • Success and Failure Case Study
  • What should be the position and messaging
  • Brand Strategy

Indian Car SUV and MUV Product Strategy

74% of sales are coming from the 1000 cc to 1500 cc Engine product category. 54% of variants have the engine size between 1000 and 1500cc. The 1500 to 2000cc segment is a highly competitive segment.

New Product Launches:

Mahindra, Tata Motors, Maruti, and Hyundai focused on the 1000cc to 1500cc segment to launch new cars, SUVs, and multi-utility vehicles (MUVs) because it is the largest segment in India.

Engine Type Indian Car SUV and MUV sales and Variants

Buyers are expecting a high-capacity Engine because of a better driving experience.  SUV C, SUV D, and SUV E are the most significant segments due to their demand among buyers in India.

Brand-wise Competitive Analysis of Indian Car, SUV, and MUV Segment Product Strategy:

Hyundai and Kia are targeting an 80% similar customer segment. However, there are certain advantages to such a product position as well. Product overlapping has short-term benefits because there is limited choice at the time of product upgradation.

Mahindra offers uniform variants across all major segments, as shown in the chart below.

Indian Brand wise Product Strategy Analysis

Maruti Suzuki primarily focuses on the 1000cc to 1500cc segment because it targets buyers who are willing to pay between 5 and 12 lakhs.

Volkswagen’s product strategy is aligned with market trends, but the brand is facing other critical issues.

Tata Motors also offers multiple variants in the 1000- to 1500-cc engine segment.

Please get in touch with us to get the full report, Indian Car Product Strategy

Indian Variants-wise Car Data is our exclusive data, providing macro-level details and sales trends. Approximately 200 models are available in the Car, SUV, MUV, and Van segments in India in 2024. The corresponding variants of the 210 models are around 1600 plus. The Indian passenger Market has a wide range of offerings for customers—4.2 million Passenger vehicles were sold in 2024.

Car SUV and MUV Models and Variants

Variant-wise Indian Car and SUV Sales and Product Data are available with the latest updates. Variants of Cars, SUVs, and MUVs play an essential role in product and Sales Strategy because they show the product position. Earlier, the top-end model was not as popular; however, this trend has since changed.

Some variants offer different price points to cater to various customer segments.

Overall, business performance has been impacted by the distribution of variants for each Model.

For OEMs and Startups:

Maruti Suzuki, Tata Motors, Hyundai, and Mahindra are offering the maximum number of Variants. Only the top 4 brands offer more than 50% of the variants. These are the Top brands in the Indian Passenger vehicle Market in 2024. Others, such as MG, Toyota, and Kia, have a 5% share in the Indian PV market.

Some variants are popular and a good example of product-market fit.

In terms of Models, Mercedes and BMW have a wide model range, which includes the right product mix.

Some Models have an overlap among the Affordable, ValuePlus, Premium, Luxury, and  High-end segments. However, the Model perception for buyers is also essential, as it influences the product’s position in the customer’s mind.

The variants have a different price bracket. Our Indian Indian Variants-wise Car Data provides the price band of each model and its product position.

Passenger Vehicle Segment: Car, SUV, and MUV

In the Car segment, Maruti has the highest number of variants, followed by Tata Motors, Hyundai, and others, including Bentley, Porsche, and Skoda. Maruti is the leading brand in the Indian Car segment because it has been producing sustainable cars for decades.

Indian Car Sales and Model to Variants

The SUV segment is the fastest-growing segment in India. Hyundai, Mahindra, and Tata Motors have the most significant number of variants, as all three brands are aggressive in their efforts to gain market share in the SUV segment.

Indian SUV Sales and Variants wise Sales

Toyota, Kia, and Maruti are leading brands in the Indian multi-utility vehicle (MUV) segment. This segment presents an attractive opportunity for new brands seeking to expand their business, as only three brands currently hold a significant market share.

Indian MUV Sales and Variants wise Sales

Please get in touch with us to get the variant-wise Indian Car Data.

Maruti Suzuki is losing market share due to a lack of new product launches, High competition from local players like Mahindra and Tata Motors, and customers’ preference for premium and luxury cars, SUVs, and others.

There is a zigzag pattern in Maruti Suzuki’s Sales growth and regrowth from 2014 to 2024.

Maruti Suzuki Sales Trend 2014 to 2024

Small and Affordable car portfolio was the biggest USP for Maruti. In the current scenario, it has become the biggest challenge. Maruti Suzuki is losing its grip on the common man’s preferred car choice.

Maruti Market Share from 2014 to 2024


Maruti Suzuki is losing market share because its small, affordable, and value-plus cars market share has declined. In 2014, the affordable car segment held a 12% market share, which decreased to just 1% by 2024.  Similarly, the Value Plus segment accounted for 63% of the market in 2014, but its share contracted to 48% by 2024. Maruti Suzuki was known for Small and affordable cars. This was one of the reasons that it commanded the Indian passenger Market for decades. In both segments, Maruti Suzuki had a market share of 5% and 37.5% in 2014. In 2024, the company lost grip on both segments. The Maruti lost 10% of its market share in the Value Plus segment and 4% in the Affordable car segment from 2014 to 2024. The overall Indian car and SUV market is moving towards the premium and luxury segments.

Maruti Suzuki Market share in India

To regain the market share, there are two key options:

  • Promote affordable Cars like Alto and try to change the market demand
  • Align with the market dynamics, accept it, change the Brand perception, and create a product portfolio

Both options are challenging because changing market demand is difficult; usually, this is the approach taken by European OEMs in India. The customer mindset, Economics, per capita income, social life, and culture all have a combined impact on the market dynamics.

Finding space in the premium and luxury segments is also challenging because numerous successful car and SUV models are already present. Brand perception also plays a crucial role in purchase decisions.

Maruti Suzuki Product Strategy:

Maruti needs to enhance its presence in the Premium and Luxury segments. The future trend indicates that these two segments will have impressive growth.

The company needs to work on the Electric car segment as well to maintain its momentum and market share.

Currently, there are no Cars and SUVs available in Maruti Suzuki’s portfolio if buyers upgrade their vehicle to the premium or Luxury segment.

Maruti Suzuki Product Strategy

Tata Motors and Mahindra are examples of how they changed the brand perception among Indian buyers. Both Brands are well accepted by customers. Customers are willing to pay a premium for their cars and SUVs.

Contact us to get the Full detail Report. Why Maruti Suzuki Is Losing Market Share


Pricing strategy is one of the most dynamic and key ingredients for success in the Indian Car and SUV market.

India should not be considered a highly price-sensitive segment because premium and Luxury Cars and SUVs are in high demand. It is expected that the Affordable and value-plus Car and SUV segment will decline by 9% and 3% CAGR from 2025 to 2030.

The Premium, Luxury, and High-end Car and SUV segment is expected to grow at a 7%, 8%, and 11% compound annual growth rate (CAGR) from 2025 to 2030.

Indian Car and SUV segment wise forecast 2030

The reasons behind these trends are product specifications and features, as well as a change in customer purchasing behavior.

The rise in income and the customer’s awareness of the benefits of features are key reasons behind this shift. Since disposable income has increased over the last decade, the upper-middle class population has been rising. This is supported by India’s fastest GDP growth and the development of its road infrastructure.

Status symbols and easy finance facilities are another key driver to move towards the Premium car and SUV segments.

A large chunk of the buyers are not first-time car buyers. In the second purchase, they upgraded their car or moved to an SUV.

OEMs are also launching new models in the Premium and Luxury car segments.

The Rise of Premium and Luxury Car Culture in India

ValuePlus SUV was the dominant segment in 2019 because buyers were expecting a little better experience compared to a car. This value-plus segment was also suitable for their buying power.

In 2024, the Premium segment surpassed ValuePlus in terms of size, as buyers expect great value from their SUV for a long-term investment.

Indian Car and SUV segment Analysis

In the Indian Car segment, the Value Plus segment remains popular because it fulfills buyers’ needs. The affordable segment is losing its grip because it offers only basic features and is akin to the next update of a two-wheeler.

Competitor Analysis: Variant-level Price Point

In India, 50% of cars, SUVs, MUVs, and vans are priced between ₹ 1 and ₹2.3 million.

Half of the models are priced below 1.5 million INR, and the other half are above this price point.

The SUV segment is the most attractive in India. Around Half of the Models in the SUV segment are priced between 1.2 and 2.2 million.

Models and Variants in the MUV segment have a price range between 1 and 1.9 million INR.

Indian Car SUV MUV variants and model wise price range

Low Competition Meets High Demand 

The segment that has a large size but a low number of models is the attractive segment.

Indian PV market size and competition analysis 2024

By 2030, the price segment of INR1.5 to 2.0 million is expected to experience high growth, making it an attractive market.

Please get in touch with us to obtain the full report on the Indian Car Pricing Strategy.

The Indian Passenger Vehicle Market showed a CAGR of +5.2% from 2014 to 2024. However, the market is likely to experience some correction, reflecting a slight rebound in 2025 compared to 2024. It is expected that by 2030, the Indian passenger vehicle market will touch 5 million.

The Indian passenger Vehicle market size was USD 46.5 billion in 2024, compared to USD 22.58 billion in 2014.

Mahindra is in second place in terms of Value in Billions INR.

Indian car and SUV Brand wise Revenue 2024

The Indian PV market reached 4.2 million units in 2024, 1.7 times the level in 2014. The peak of the pre-COVID level was 3.4 million units. From 2021, Passenger vehicles bounced back and surpassed the pre-COVID level in 2022. The Indian Passenger Vehicle Market recovered quickly after the COVID-19 pandemic, registering a 15% compound annual growth rate (CAGR) from 2020 to 2024.

Indian Passenger Vehicle Market Forecast 2030

From Diesel to Electric: India’s Powertrain Transition Unfolds (2014–2024)

In 2014, Indian Passenger vehicles, which include SUVs, Cars, and Vans, were available mainly in Petrol, Diesel, and Petrol/CNG fuel types. In 2014, Diesel and Petrol vehicles were replaced by Petrol-CNG, Electric Drivetrain, Strong Hybrid, and other fuel types.

Indian Car and SUV Fuel Type Sales Trend

Electric Car and SUV reached to 2.5% market share in 2024.Petrol-CNG demand is continuously increasing, with an 18% market share, up from 6.4% in 2014. Strong Hybris vehicle is also getting popular in 2014.


SUV, MUV, Car, and Other Segment:

The SUV segment share has increased from 14% to 53% between 2014 and 2024. The SUV segment is expected to hold more than 50% of the market share in 2024. Hyundai recently announced it will launch new models in the SUV segment to regain its market share.

The MUV segment also gained a 6% market share, while the Car segment lost a 40% segment share over the last 10 years.

Indian Car SUV and MUV Market share trend 2024

SUV sales have been in top gear since 2021. This segment achieved a 20.3% compound annual growth rate (CAGR) over five years. There are multiple reasons behind this trend, the most important of which is that customer purchasing power has increased. Many models have different features and price options.

SUVs are available for less than 10 lakhs, an attractive price point. This price point attracts a large number of buyers because the per capita income is continuously increasing. The finance is readily available.

Indian Passenger Vehicle Market Trend

The MUV segment is expected to register an 8.2% CAGR from 2014 to 2024. The market size doubled in 10 years because the MUV vehicle meets family requirements, including sufficient space, safety, comfort for long distances, and DIgital features. MUVs like Ertiga and Carens are in high demand.

On the other hand, the car segment is losing its momentum continuously.

Competitor Landscape: Car, SUV, and MUV

Maruti Suzuki continues to hold the leading position in the Indian Passenger Vehicle segment. Maruti’s market share declined by 5%. If the Van segment is excluded, there is a loss of 7% market share. The reason behind it is that the overall car segment declined, and Maruti was known for its leading position in the Small car segment. The car segment is continuing to fall, and it has a direct impact on Maruti Suzuki’s performance.

Indian Car Market Share 2024

Another traditional second-largest player, Hyundai, is also losing its market share. Tata Motors, Mahindra, and Kia are growing due to the launch of their new models and their product-market fit.

Indian Car Buyers Shift Focus to Premium Hatchbacks

Premium Hatchback is the top choice in the car segment because it offers a balance between cost and advanced features. This is the ideal car for urban areas. It comes with attractive mileage and an easy-to-find parking place.

New models are arriving with premium quality and advanced safety features, including Anti-Lock Braking System (ABS).

Indian Car segment Share 2024 trend

The Segment share of Premium Hatchback cars increased from 37% to 57% in the last 10 years. All other segments lost their share in the same period.

Indian Buyers prefer large SUVs:

The SUV D-segment increased its market presence from 26% to 37% between 2014 and 2024. Indian buyers are recently upgrading the test of SUVs. The C-segment SUV also experienced steady growth. This segment share increased by 2% over the last 10 years. In 2014, the SUVB segment was a growing segment; however, by 2024, it had lost its momentum.

SUV market share in India in 2024

Buyers in the MUV segment are also focusing on more premium models.

Please get in touch with us to obtain the Full Report and Forecast for 2030.