The cogs of Indian infrastructure have been moving on rapidly in the last two decades, especially in the field of surface transport. The bus transport has thrived very well in Indian roads owing to their excellently built roads and favourable conditions. Buses have a become an integral part of urban as well as rural life. The following report briefly introduces the bus sales strategy and business planning research which is undergone in doing the same. In this report, we also focus on primary and secondary research analysis, product life cycle, automotive and marketing strategy.
The demand for a number of good quality buses has given the automotive industry something to expect. Also, the fact remains that this industry is one of which still remains to be delved into further and hence, it is a potential gold mine industry we might be sitting on, literally. One day, over the years, to come OEM pioneers like Volvo, Scania and Mercedes are expected to capture the market. The coming of a new dawn will also enable many other new players to enter into the scene. A very promising environment awaits the new players who are yet to enter into the segment.
With the objective of keeping in tune with the global standards, the Indian government has planned to implement a new, improved Bus Safety Code. This improved bus code is expected to be guidelines in view of maintaining safety as well as comfort. Though this will no doubt be of use in the future, new players will have to up their game to keep on par with such a radical system. To keep up with the new system will be one of the biggest challenges the bus industry will face in the future, as the new technology which complies with the bus code needs to use.
We at ACG have studied the product features based on applications, city and bus code regulations. A few key features of this study are given as follows:
1. State wise market dynamics which stakeholders need to account for.
2. The >5T GVW segment has shown more than a double digit market size growth in the past few years.
3. GVW wise: 5T,7T, 9T, 12T and >12T
4. Bus Application wise
Being a culturally diverse country, our regional geographical factors contribute a major part to the automobile industry. So, in a country as vast as ours, it makes more sense to analyse the data city, state and zone wise analysis to gain a little more clarity and depth. The conical matrix that ACG follows accounts for all the parameters required for a macro level research. Surveys undertaken in various parts of the country have led to the need for color coding safety compliant buses to gain more awareness among the people on the same.
The market size variation from 2009 – 2015 in the >5T department and the zonal wise market share of the parts of India every year from 2009 to 2015. It is evident that South India captures the largest market, followed by North, West and East India. The South Indian market is ruled mostly by new buses. In stark contrast, North Indian roads are fleeced with old buses. The color coded safety indication system could begin on a trial from South India, given that they are the largest segment. The detailed report gives a little more insight on the factors that play an important role in sales in each region of India.
The Premium segment of the bus market has seen a refreshing growth in sales and it may just return more positive investment in the long run, though the initial amount may be high.
Bus Running cost structure:
The major cost factors that goes to Fuel cost and EMI. As it can be clearly observed, most of the expenses are eaten up by fuel costs. Initial investment and other additional costs like tire, crew, and maintenance are incurred.
The growth in each part of India is analysed and compared to the year 2009 and in the year 2015 along with forecast 2025. The South have registered a double digit increase in their sales. The Northern part of India has seen its sales rise by more than 20%.
Trends in the market :
1. The South and North Indi markets have shown an upward curve growth since the year 2009. This can be accounted to better roads, a number of passengers, improved lifestyle, and willingness to pay. TamilNadu and Rajasthan are one among the best performers.
2. A significant drop is seen however during the same period in the East and West zones, with Uttarakhand being the least performing state.
3. The southern travellers are open to paying higher fares for receiving more improved versions of transport. However, the North Indian passengers are reluctant to pay that high.
4. When analysed brand wise, we see that Ashok Leyland and Tata Motors have shown a major drop in market share.
Top Bus States in India:
States in the south like Tamilnadu and Andhra Pradesh are recording an upward curve. Uttar Pradesh, however, recorded a major decrease in its market share.
- Region wise fleet life is different in all states
- Region wise fleet wise, APSRTC is the largest.
- Market size, Major Models, Market leader, and Applications of Buses:
Tata Motors has successfully imprinted its hold on the 5T to 9T segments and the higher tonnage segments are dictated by Ashok Leyland.
With respect to market size, luxury buses seem to have the most impact. However, budget buses seem to the safe and comfortable option for most passengers. Though the initial investment is high with these luxury buses, the ROI they give is considerably more. Companies like Scania have managed to break the monotony by creating an impact, challenging the monopoly of brands like Volvo. However, few European companies still find it hard to plunge into the luxury bus segment. Technical breakdowns have reduced to a large extent due to the introduction of Dashboard diagnostic tools.
TCO and ROI are different for Luxury,premium, budget and low-cost buses.Though may characteristics are similar like the revenue collected and the seating layout, the output seems to vary with the two. The total cost is exceedingly higher with luxury buses and total profit incurred with luxury buses are almost three times as compared to luxury buses.
The following entails a detailed description based on primary and desk research and arrives at the most fruitful model that was analysed here at ACG. It provides the most important parameters that one may easily overlook while buying a bus.
ACG has undertaken an in-depth analysis to understand what are the most important aspects of has to look into while buying a bus and has understood that a brand name is one of the least important aspects whereas fuel efficiency is given top notch priority as that decides profits incurred in the long run.
This classification is done by categorising the population into strands which cater to a particular budget. For example, the more lavish route run buses are mostly taken the foreigners who visit India to travel to tourist spots like Agra, Jaipur, etc. On the other hand, this market also caters to the low-income specifications of students in routes that run from Indore to Mumbai or from Bangalore to Pune.
This analysis also takes into view the businessmen who travel frequently and mostly all-night, round trips. It also accounts for Indian tourists who are the economy travellers frequently traversing the Delhi-Agra, Bangalore-Goa routes.
Strategising market intelligence state wise helps to provide additional information about the Indian bus industry. This can be utilised by OEMs and new entries to sketch their own strategies based on the already available data. The report has helped to cater to their weds and enable them to come up with their individual strategies to penetrate the market.
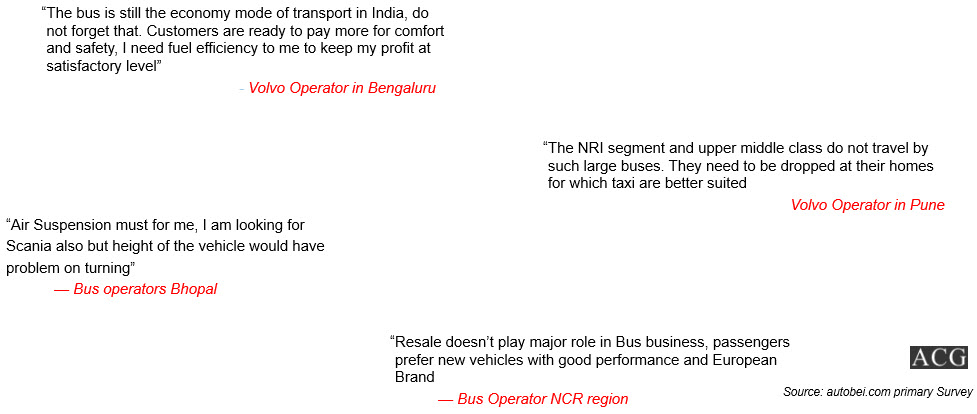
We at ACG also met with many fleet owners in India to further gather a deeper of the understanding of the system we work with, and this is what they had to say.


