Executive summary: car registrations by RTO in India are won fuel by fuel, and the EV gap is concentrated
Car registrations by RTO in India show a market that is won locally, fuel by fuel, and often by a thin margin. We analysed passenger car registrations across 1,408 RTOs for January to September 2026. Four findings stand out.
- Leadership depends on the fuel. Maruti Suzuki leads petrol and CNG, Mahindra leads diesel, Tata Motors leads EV, and Toyota leads strong hybrid.
- The leader changes inside one RTO. Even the EV leader differs by RTO: Tata Motors in Banaskantha and Bareilly, JSW MG Motor in Bengaluru Central.
- The EV gap is a volume story. The largest gaps sit in big RTOs where EV share trails peers. Two metro cities hold the biggest city-level gaps, in markets with open competition.
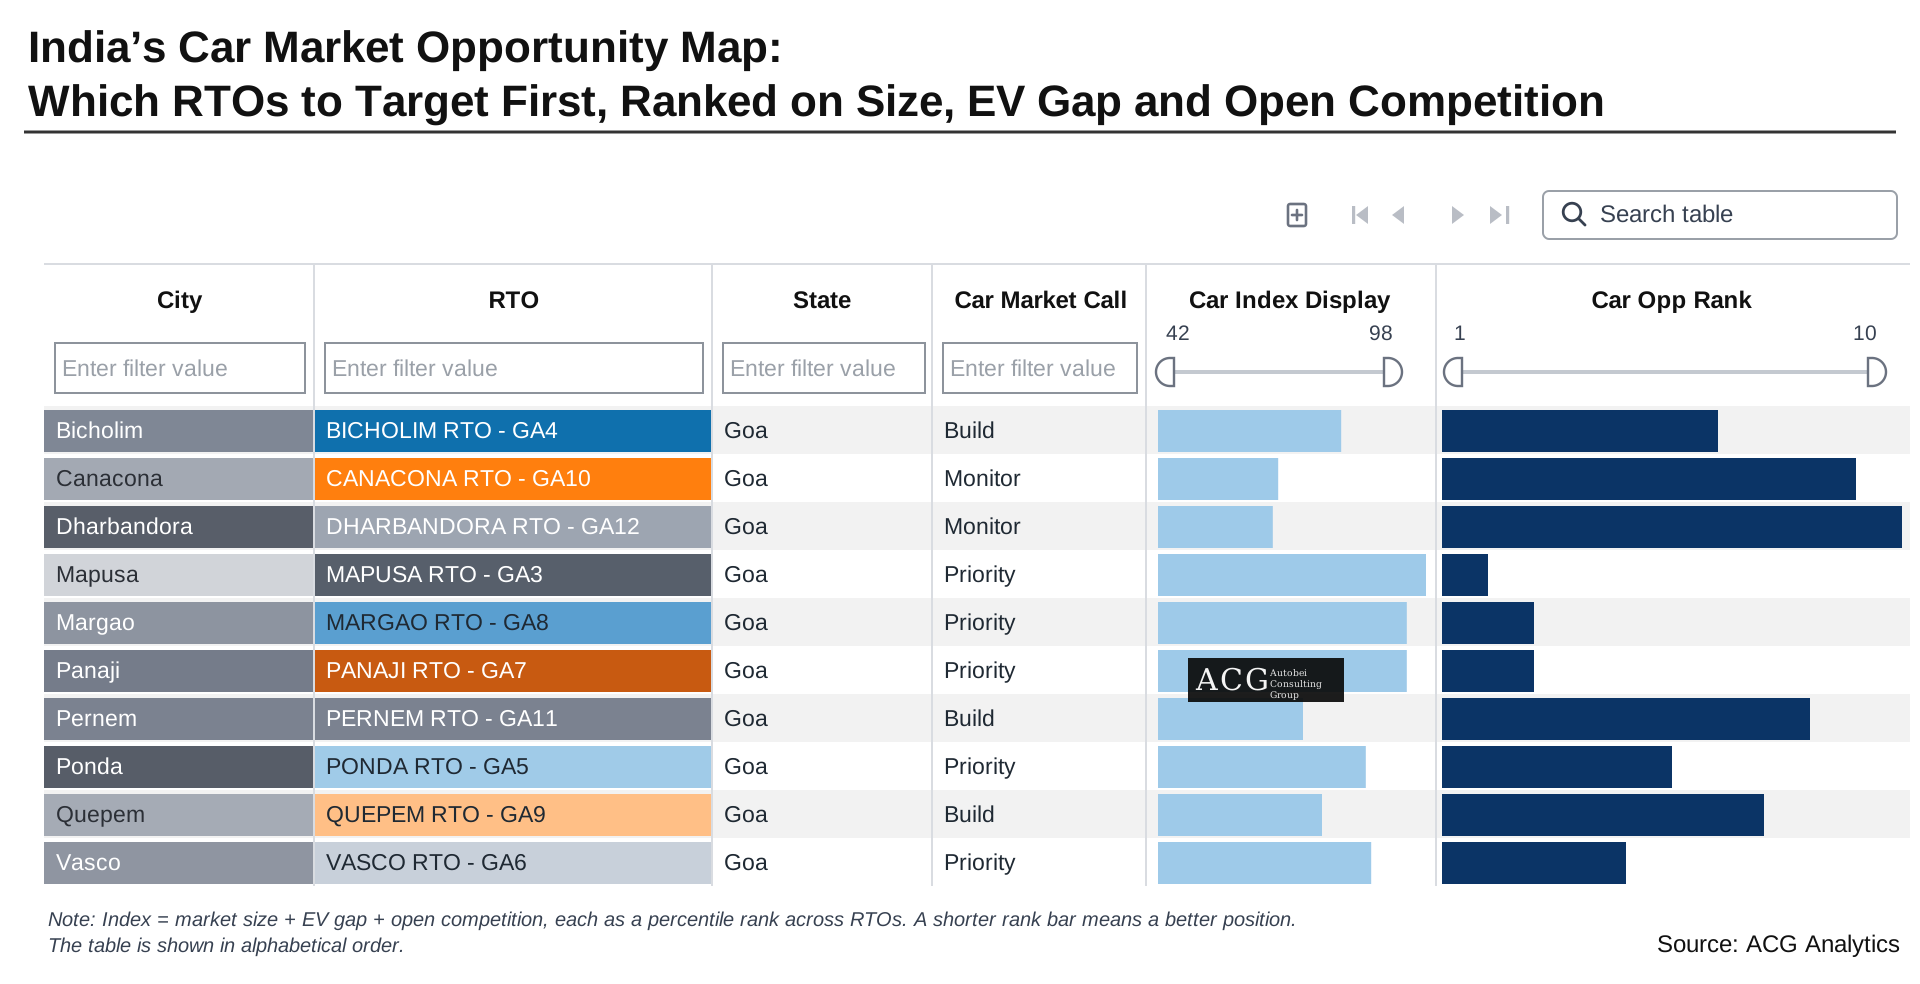
- One score turns this into a target list. Market size, EV gap, and open competition rank every RTO as Priority, Build or Monitor.
Entry plans, dealer footprints and charging investments should be set RTO by RTO and fuel by fuel, not state by state.
Each large maker owns one fuel, and most of its leads are secure
We first asked who leads each RTO within each fuel, and by how much. Every lead was then grouped by its gap to the runner-up: very close (under 10%), close (10 to 30%), leader ahead (30 to 60%), and dominant (60% and above).
Exhibit 1: Maruti Suzuki, Mahindra and Tata each dominate different fuels, so leadership depends on the fuel, not just the maker
Number of RTOs led by each maker, by fuel and size of lead over the runner-up, India passenger cars, January to September 2026
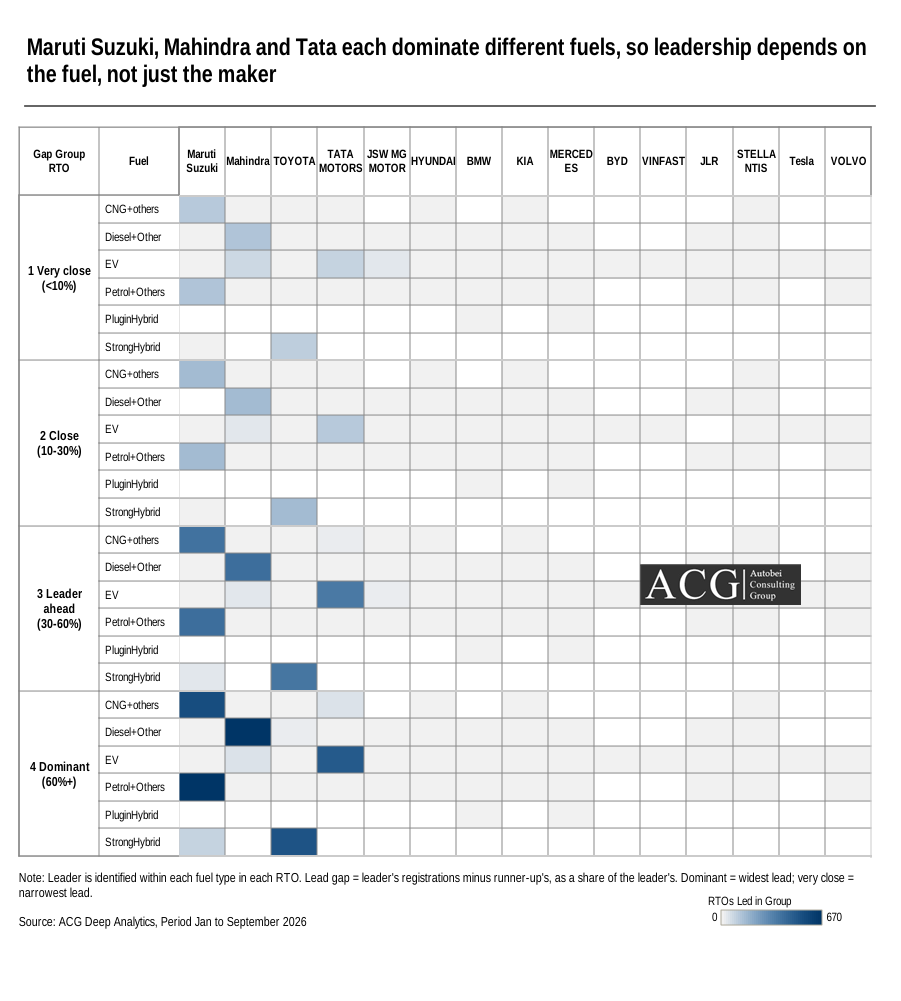
This chart counts RTOs, not cars sold. Each cell shows how many RTOs a maker leads in one fuel, grouped by how far ahead it is of the runner-up. Maruti Suzuki leads petrol and CNG, Mahindra leads diesel, Tata Motors leads EV and Toyota leads strong hybrid. A darker cell means more RTOs led. Most leads in the main fuels are comfortable, while EV leads are still tight in several RTOs.
Two details matter for planning. First, for the main fuels, most leads sit in the leader-ahead and dominant bands, so these positions are hard to dislodge. Second, EV is the contested fuel. In the very close band, EV leads are split across Mahindra, Tata Motors and JSW MG Motor.
Zoom in, and the EV leader changes from one RTO to the next
The matrix shows the national pattern. To test it, we opened the underlying RTOs. Exhibit 2 shows three of them with the full numbers, so the reader can check the logic.
Exhibit 2: Inside one RTO the leader changes with the fuel, and the EV leader changes with the RTO
Leader, runner-up, registrations and leader share by fuel, selected RTOs, India passenger cars, January to September 2026
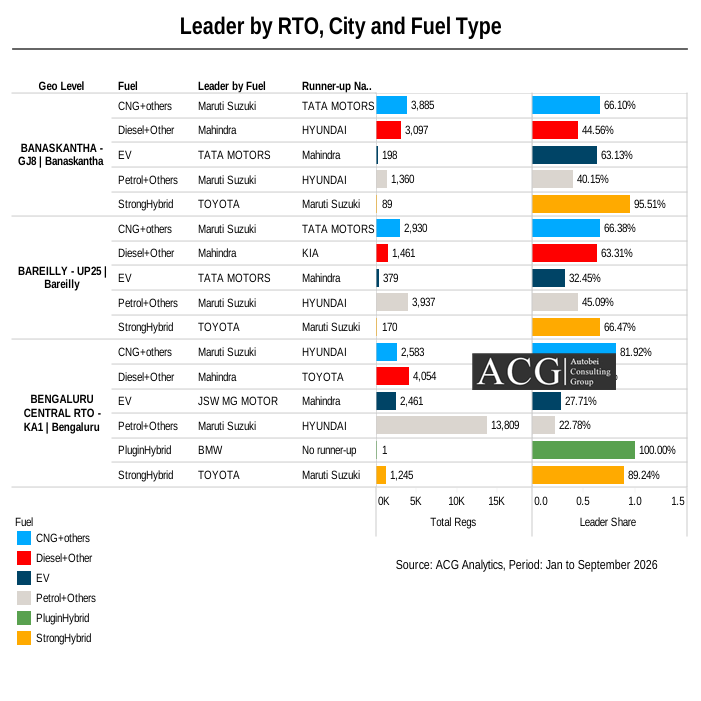
RTO- wise key insight: Example
- The fuel pattern repeats. Maruti Suzuki leads petrol and CNG, Mahindra leads diesel and Toyota leads strong hybrid in all three RTOs. Only the runner-up changes: Tata Motors sits behind Maruti Suzuki in CNG in Banaskantha and Bareilly, while Hyundai does in Bengaluru Central.
- The EV leader does not repeat. Tata Motors leads EV in Banaskantha (63% share) and Bareilly (32%). JSW MG Motor leads in Bengaluru Central (28%), with Mahindra second.
- Size and concentration differ. Bengaluru Central is far bigger, with 13,809 petrol registrations and a leader share of only 23%. That is a large, fragmented market. In Banaskantha, CNG has 3,885 registrations and Maruti Suzuki holds 66% of them.
A PAN-India or state-wise share figure hides the real contest. The same maker can be dominant in one RTO and a challenger in the next.
The biggest EV gaps sit in large markets, not in the lowest-share ones
The biggest EV gaps sit in large RTOs, not in the RTOs with the lowest EV share. That changes where a car maker or a charging operator should look first.
Exhibit 3: Priority RTOs are the large markets where EV share trails peers
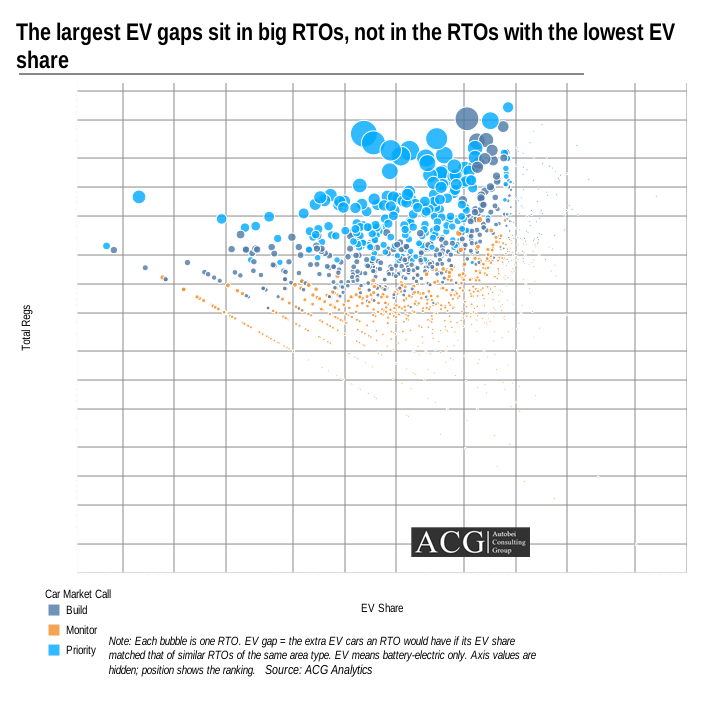
How to read Exhibit 3: each bubble is one RTO. The further right, the higher its EV share. The higher up, the more cars it registers. A bigger bubble means a bigger EV gap, and bright blue marks a Priority RTO (the scoring is explained further down).
Four things stand out.
- The biggest bubbles sit at the top of the chart. The large bright-blue bubbles are high-volume RTOs, and they are not at the far left. Volume drives the gap more than share does.
- The far left is full of small dots. These RTOs have the lowest EV share, but they register few cars. There is little to win, so the bubbles stay small.
- The orange dots in the lower middle are Monitor RTOs. They are small markets. Even a low EV share leaves few cars at stake.
- The right side fades out. RTOs that match or beat their peers have no gap, so their bubbles shrink and disappear.
The takeaway is to rank RTOs by cars at stake, not by share. A plan that starts from the lowest share would begin with the smallest markets.
Two metro cities pair the biggest EV gaps with open competition
A large EV gap is only attractive if a new player can win share. So we added a second lens: how concentrated the maker competition is in each city. We measured it with the Herfindahl-Hirschman Index (HHI), where a low value means no maker dominates.
Exhibit 4: Two metro cities combine the largest EV gaps with open to moderate competition
City EV gap in cars against average city HHI; colour shows area type. India passenger cars, January to September 2026
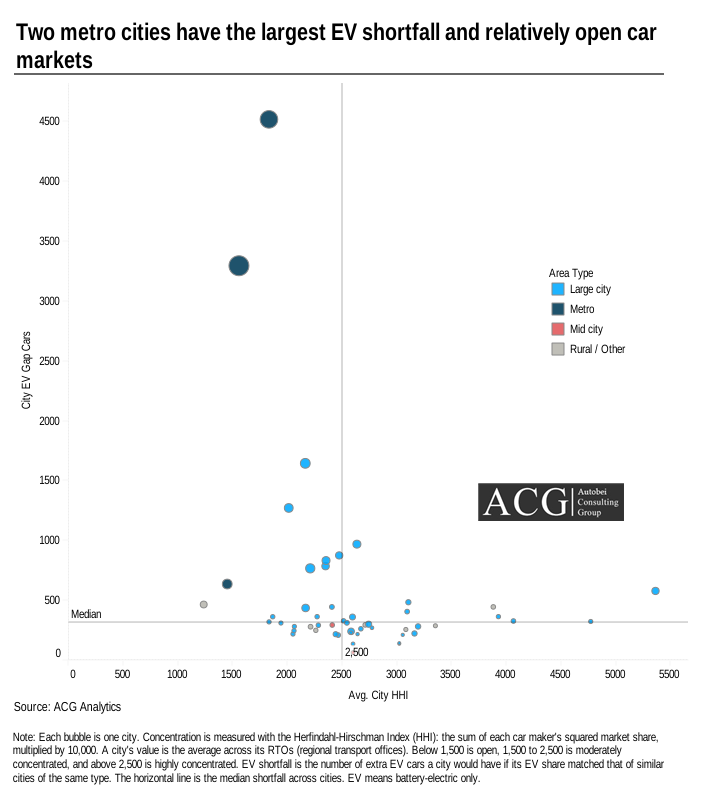
Read the chart by quadrant.
- Top left: large gap, open market. Two metro cities stand far above all others. Their HHI sits at about 1,500 to 1,800, so no maker holds the market.
- Upper middle: the next tier. A handful of large cities add gaps of about 900 to 1,700 cars, mostly at moderate concentration.
- Bottom right: small gap, concentrated market. Most cities sit here. Few cars are at stake, and one or two makers already control the city.
The top-left quadrant is where an entrant can move first, because the prize is big and the incumbents are not locked in.
Frequently Asked Questions
One score turns the analysis into a ranked target list
The last step combines the three lenses into one score for every RTO. The score is built from three parts, each ranked across all RTOs as a percentile:
- Market size: how many cars the RTO registers.
- EV gap: how many EV cars it is short of its peer group.
- Open competition: one minus the leading maker's share.
The weighted result is an index from 0 to 100. A score of 70 or more is Priority, 50 to 69 is Build, and below 50 is Monitor. The weights and the minimum volume are adjustable, so a user can reflect a different strategy.
Exhibit 5: India’s car market opportunity map: which RTOs to target first, ranked on size, EV gap and open competition
Opportunity index and rank by RTO, with the opportunity call. India passenger cars, January to September 2026
In big cities, one maker usually runs the show
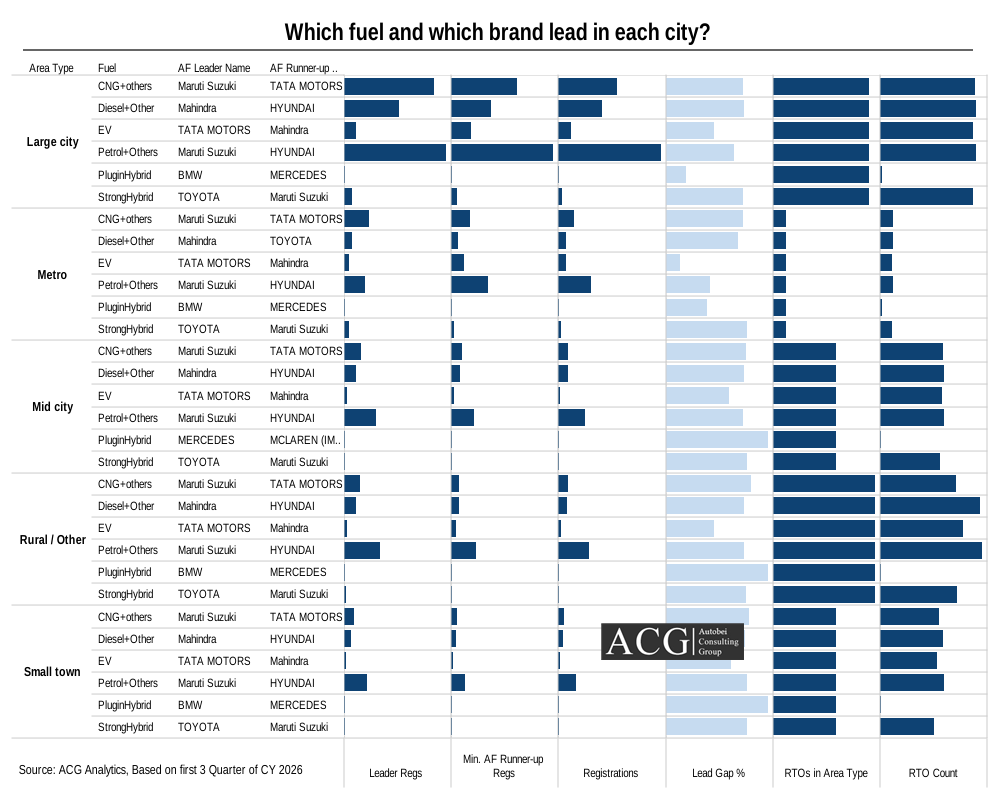
Look at large cities: Maruti Suzuki leads, and Tata Motors, Hyundai, and Mahindra trail well behind. The lead is wide enough that it won’t change soon. EVs have a different picture of the market.
If you’re picking cities to enter, start with the question of how safe the leader’s position is. A dominant leader in a large city means a hard fight. A narrow lead in a smaller city means a real chance.