The global electric two-wheeler market is projected to reach USD 70.09 billion by 2030 with an expected CAGR of 7% from 2020 to 2030. China, India, Vietnam, Thailand, Indonesia, and Europe are the largest Electric Two-wheeler market in the world.

The report and Data are based on Electric and ICE drive systems. The following three segments are covered:

  • Moped,
  • Scooter, and
  • Motorcycle

Electric two-wheelers held a global market share of 20% in 2010, and it is projected to reach 70% by 2030.

Top Global Electric Two Wheeler Market Forecast 2030

Taiwan has increased its Electric Two- two-wheeler sales from 4% in 2015 to 14% in 2022. China’s fleet of electric Two-wheeler sales increased from 40% in 2015 to more than 60% in 2022.

Electric Two-Wheeler Country wise market Trend and Forecast 2020 to 2030

Globally, the Lithium Ion Battery demand will be 115 GWh per year for Electric Two Wheeler and the Battery chemistry mix will be dominated by LPF, and NMC (9.5.5 & 811).

The Lithium, Nickel, and Cobalt demand for Electric two-wheelers expected to be 66,700 million metric tons per year, 35 million metric tons per year and 8,490 thousand metric tons per year by 2030.

Global Electric Two-Wheeler demand supply by 2030 will be 36.4 TWh which is around 35% of total electricity demand for Electric vehicles excluding China.

Among USA, Japan, Taiwan, Europe, and India have a maximum of Electric Two-Wheeler manufacturers.

Gogoro, Ola, and Ather are some of the top fundraised manufacturers.

The Report covers all major Electric two-wheeler market like China, Europe, Indonesia, Vietnam, North America, the US, India, Japan, South Korea, Australia, Africa, Pakistan, the Philippines, the Middle East, and the Rest of the World. Along with the Sales Volume, the fleet data is also part of the report.

The upfront price of an upper-range Electric Motorcycle is expected to be USD 10,000. Electric Mopeds and Electric Scooters in upper range product range will be around USD 400 and USD 800 by 2030.

The total cost of ownership (TCO) is the most attractive in India compared to China, and Indonesia.

Key Highlights of the Report:

  • Global Electric Two-Wheeler Market size market size in terms of volume (In units) and value (In USD billion) – 2015 to 2040
  • Global ICE Two-Wheeler Market size market size in terms of volume (In units) and value (In USD billion) – 2015 to 2040
  • Vehicle Type: E-Moped, E- Scooter, E- Motorcycle
  • Government Electric vehicle Policies and their impact analysis
  • Mapping Vehicle type to region/Country wise market penetration
  • Market Opportunity, Drivers, Challenges, Restraints,
    and Risk
  • Battery chemistry mix market share trend and forecast from 2018 to 2030
  • Technology Trend Analysis
  • Country wise (China, India, Indonesia), TCO Analysis and Comparison – Electric Scooter (65km, 95km, 130km+), ICE min, ICE max & min, and Gasoline Scooter
  • Go-To-Market Strategy
  • Value Proposition deliver by Electric Two Wheeler
  • Market Forecast based on:
    • Vehicle Type
    • Price Group: Economy, Premium, and Sports
    • Volt range
    • Battery Capacity
    • Battery Type
    • Vehicle Range (in Km)
    • Country and region level:
      • US,
      • China,
      • Indonesia,
      • Thailand,
      • Taiwan,
      • Pakistan,
      • Philippines
      • Middle East
      • Japan
      • South Korea
      • Vietnam
      • Australia
      • Europe
      • Africa, and
      • RoW
  • Customer Buying Behaviour Analysis
  • Customer expectation from Electric two-wheeler
  • Brand perception Analysis of OEMs, and Technology
  • Oil Demand by ICE Two-Wheeler
  • Electricity demand for charging Electric Two Wheelers from 2015 to 2030
  • Battery Demand Trend and Forecast – Lithium, Cobalt, and Nickel
  • Vehicle type and Segment wise Price trend
  • Electric Charging Infrastructure requires for Electric Two Wheeler
  • Value chain and Ecosystem assessment
  • Case study
  • Product Attribute – MVP
  • OEM Strategy and Business Model Analysis
  • Macro Economy Trend and Forecast
    • GDP growth
    • Rural Vs Urban Population
    • Porter’s Five Forces Analysis

The landscape of two-wheeler vehicles in India is shifting remarkably, primarily driven by the growing demand for electric scooters and motorcycles. This change is expected to trigger a reconfiguration of the established brands that have long dominated the industry. Traditional automakers must strategically incorporate advanced technologies to remain competitive and relevant in this evolving landscape. This includes the seamless integration of features such as connectivity solutions, mobile apps, interactive interfaces, digital communication tools, information-rich dashboards, and predictive services, among other technological advancements, all aimed at meeting and exceeding customer expectations.

Traditional Automakers are gearing up to take market share e2W segment

In this fast-changing environment, newer entrants in the industry, such as Ola, Okinawa, and Ather, are rapidly gaining ground, while traditional giants like Honda, Bajaj, Yamaha, and TVS are moving at a more measured pace, often operating in lower gears. Significantly, a steady stream of new brands consistently introduces an average of two to three new products in this segment, further contributing to the industry’s dynamic evolution.

Indian Electric Two Wheeler cumulative sales FY 2024

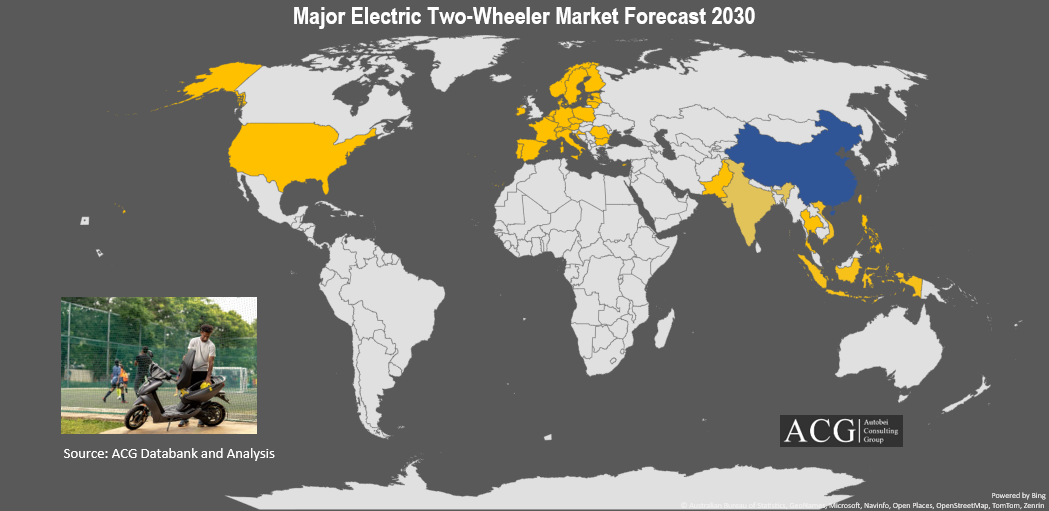
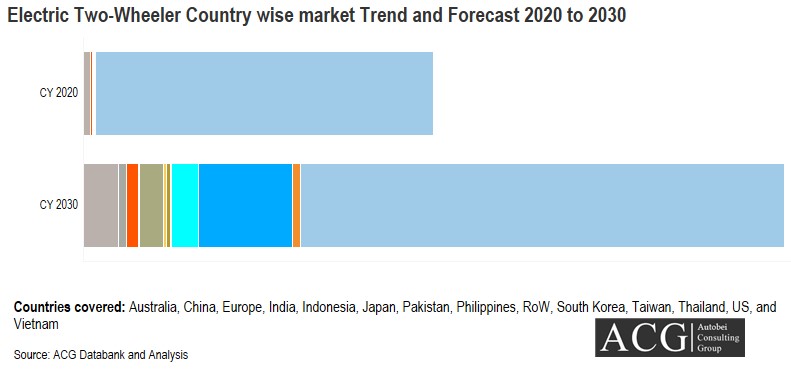
The electric two-wheeler market in India has become a familiar point of interest for both established automotive players and newcomers. This rapidly evolving segment is currently in the midst of a significant transformation.

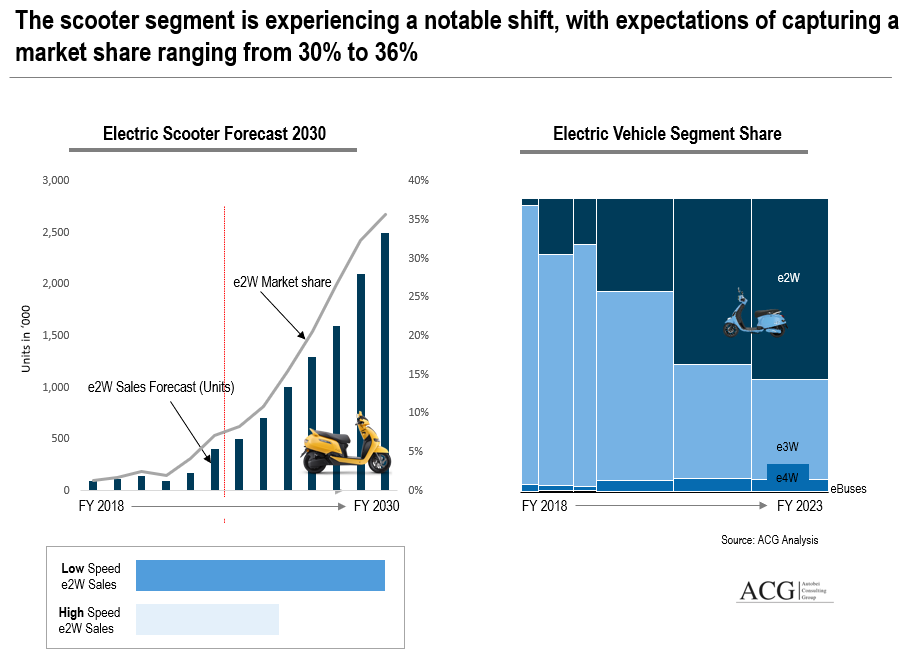
It’s anticipated that the electric two-wheeler market will reach a substantial value of approximately 2,410 million USD by the year 2030. Remarkably, the scooter segment is experiencing a notable shift, with expectations of capturing a market share ranging from 30% to 36%.

Indian Electric Scooter Sales Forecast 2030

The government has implemented a series of substantial measures to encourage the adoption of electric vehicles. These include the FAME subsidy, with FAME III currently under evaluation. The Ministry of Heavy Industries has launched Phase II of the FAME India Scheme, earmarking INR 1000 Crores to develop charging infrastructure for electric vehicles. Additionally, the government has enhanced subsidies for electric two-wheelers, increasing the subsidy from ₹10,000 per kWh to ₹15,000 per kWh, with the maximum subsidy now set at 40% of the ex-showroom price, up from the previous 20%.

The price difference between ICE and electric scooters is narrowing

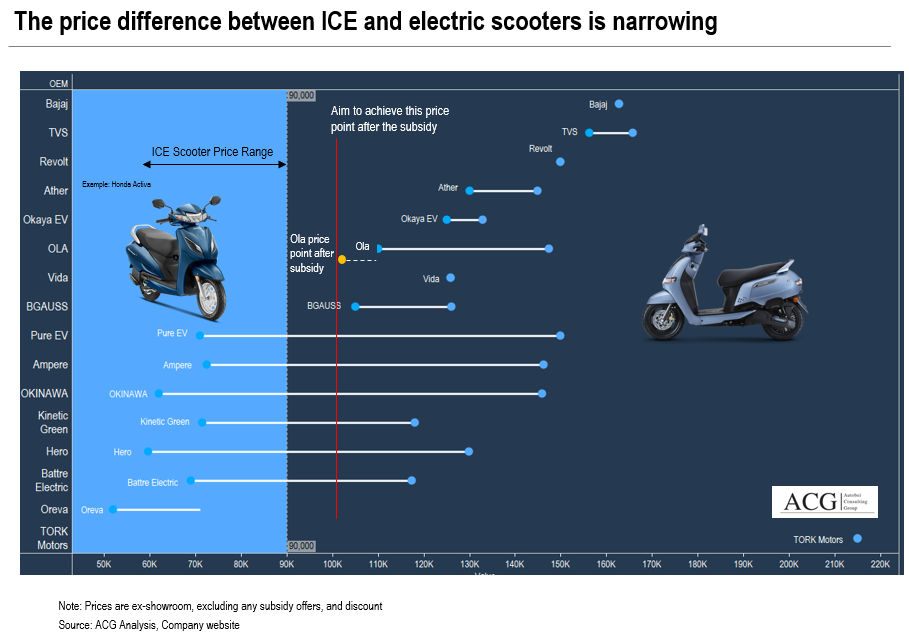
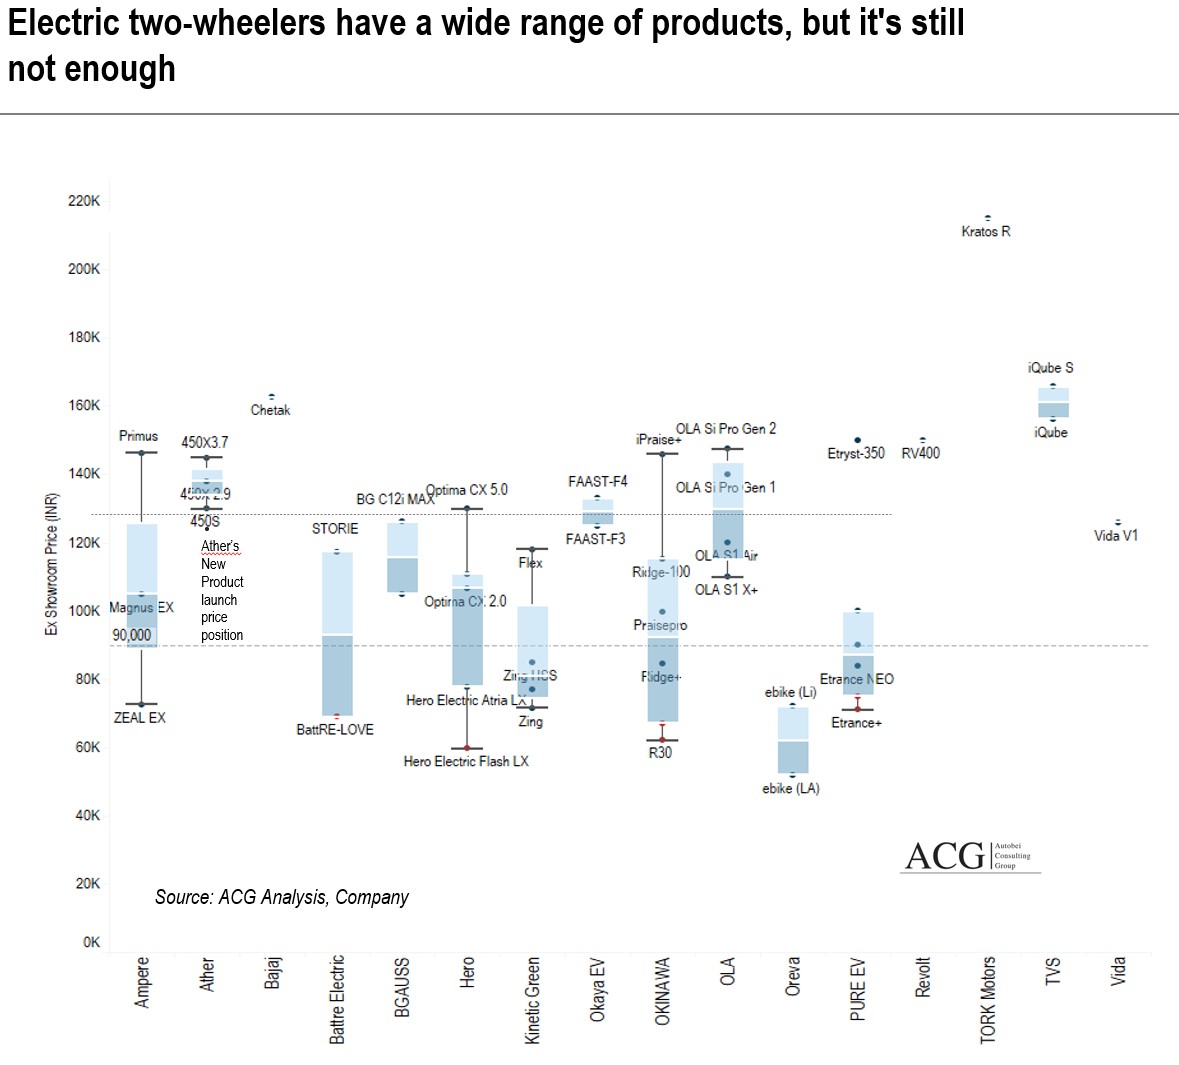
Price Point of Electric Scooter and Motorcycle:

Ampere, Hero, and Okinawa offer products across a wide price range. Ola offers models within a narrow price range, targeting closely segmented markets. Okinawa and Hero are targeting more than two segments at a time. Currently, Chetak and Tork have only single products that are closely segmented.

Electric two-wheelers have a wide range of products, but it's still not enoughAnother notable development is the approval of the Production-linked Incentive (PLI) Scheme in May 2021. This scheme is aimed at strategically incentivizing potential investors, both domestic and international, to establish large-scale ACC manufacturing facilities. The emphasis here is maximizing value addition, ensuring high-quality output, and achieving pre-committed capacity levels within specified timeframes. It’s worth mentioning that companies like Ola are actively engaged in constructing substantial 20 GWh giga battery factories for their two-wheeler portfolios.

To fuel the growth, the government has initiated significant actions to decrease the Goods and Services Tax (GST) on electric vehicles, reducing it from 12% to 5%. A similar reduction has been applied to chargers and charging stations for electric vehicles, reducing the GST rate from 18% to 5%.

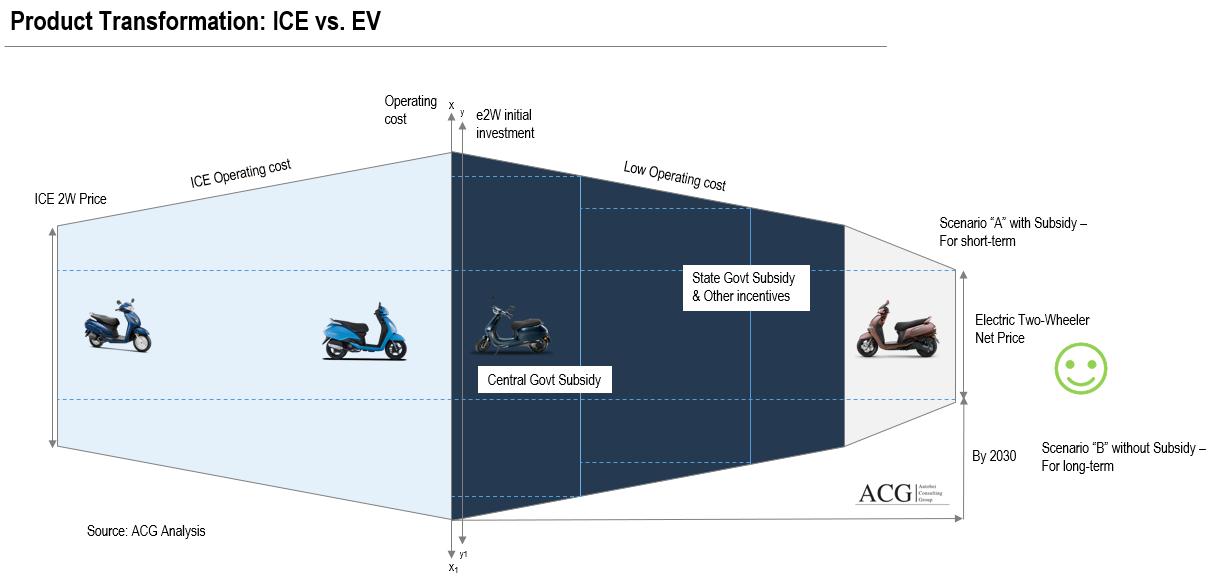
In a nutshell, these all-encompassing actions have driven the uptake of electric vehicles and significantly shrunk the cost disparity between conventional internal combustion engine (ICE) two-wheelers and electric scooters, marking a pivotal moment in the transition to electric mobility.

Turning our attention to a different aspect, India’s electric vehicle (EV) industry grapples with its distinct set of challenges. Most prominently, there is a notable deficiency in charging infrastructure, particularly in rural and smaller towns, despite the presence of over 600 charging stations along highways and expressways. Yet, this issue continues to persist and requires attention. Delving further, we gain a deeper understanding that access to electricity, especially in rural areas, is a significant obstacle that requires substantial investment to meet the growing demand for electricity by 2030. Responding to this need, the government has given the green light to establish 1,576 EV charging stations spanning 16 highways and 9 expressways.

Indian Electric Two-Wheeler Product and Customer Analytics

Furthermore, the concept of “range anxiety” contributes to the gradual adoption of electric two-wheelers. In specific regions, the absence of state subsidies for electric two-wheeler purchases amplifies the price difference between internal combustion engine (ICE) two-wheelers and their electric counterparts.

The Indian electric two-wheeler industry relies heavily on imported components, including lithium-ion or LPP batteries.

Moreover, many potential consumers still harbor reservations about embracing electric vehicles. This is partly due to a lack of awareness concerning EV technology, further compounded by sporadic incidents of electric vehicles catching fire. To foster greater EV adoption, India must craft a manufacturing-friendly policy framework. This strategic endeavor holds the promise of mutual benefit, benefiting the domestic market and positioning India as a potential exporter of electric two-wheelers to countries like Vietnam, Africa, Sri Lanka, several European nations, and beyond.

Analysing Product Portfolio, Product USP, and Competitive Landscape:

We identify three distinct categories in the Electric Two-Wheeler Industry: High-Speed Electric Scooters, Low-Speed Electric Scooters, and Motorcycles.

Electric Scooter Product USP for Indian ConsumersWhile the Scooter segment garners high market appeal, the presence of Motorcycles in the Electric Segment is notably limited. Several primary constraints hinder the adoption of Motorcycles in this segment. Firstly, the speed does not align with the expectations of traditional Motorcycle users. Secondly, the range offered falls short of the necessary requirements. Lastly, even after accounting for subsidies, a substantial price gap persists between ICE 2-wheeler Motorcycles and their Electric counterparts.

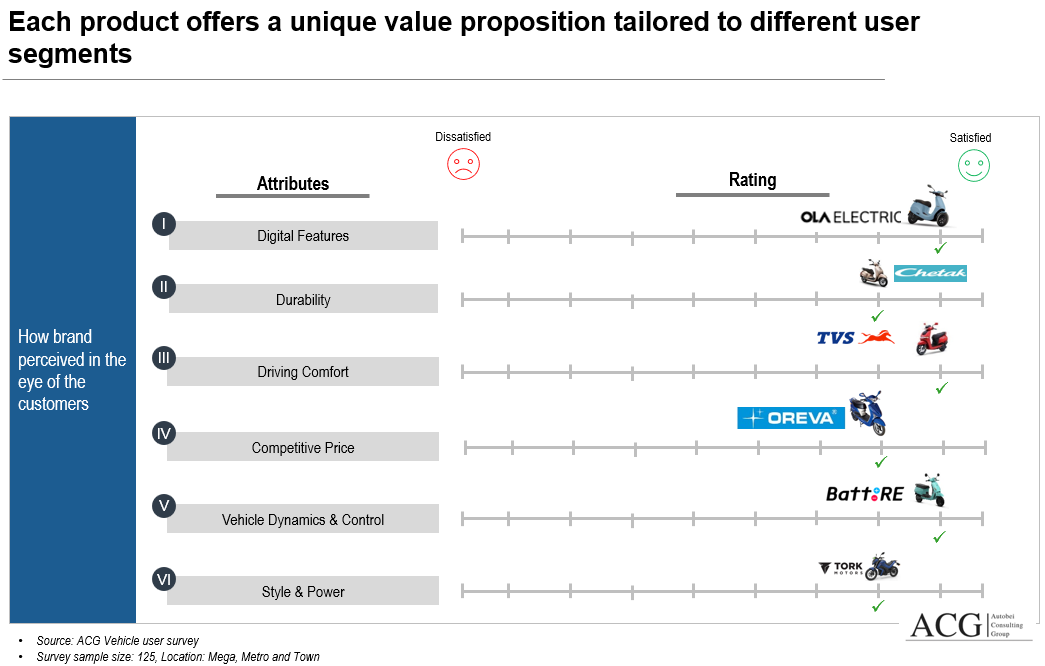
Unpacking the Influence of Brand Recognition on Consumer Behaviour:

Brand recognition shapes customer perceptions, preferences, and interactions with products and services. However, understanding the intricate dynamics of how brand recognition precisely influences consumer behavior merits closer scrutiny.

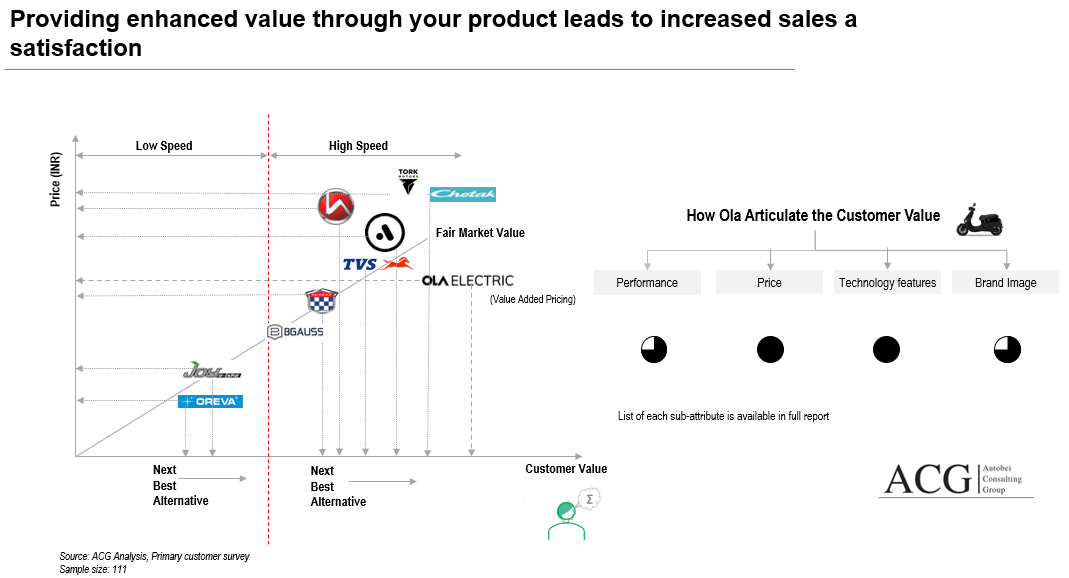
Value-driven Electric Two Wheeler results in higher sales:

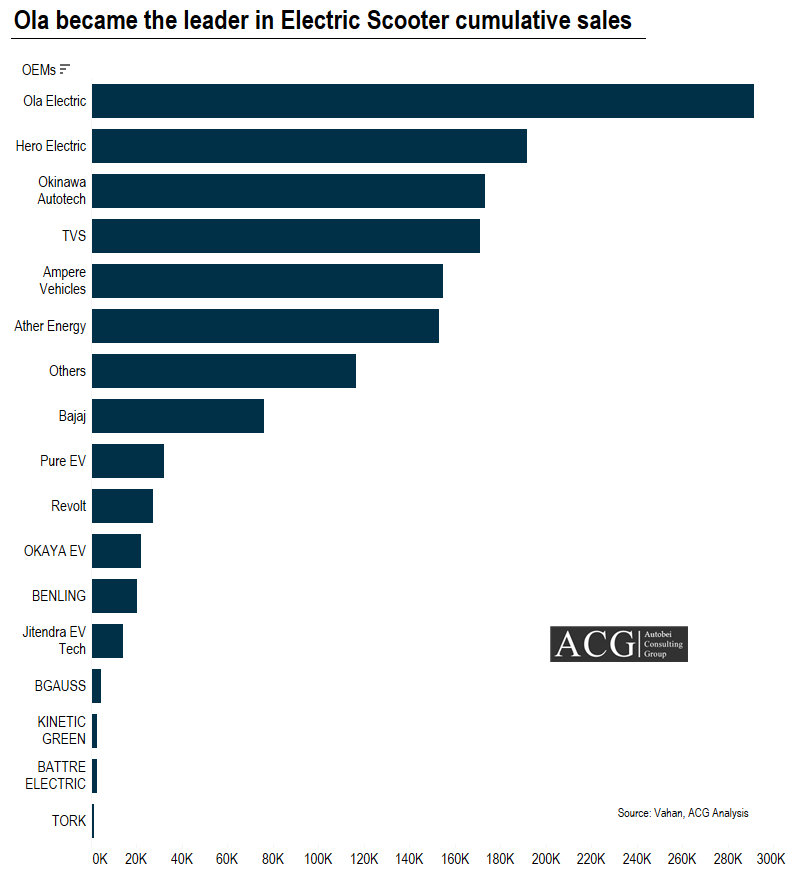
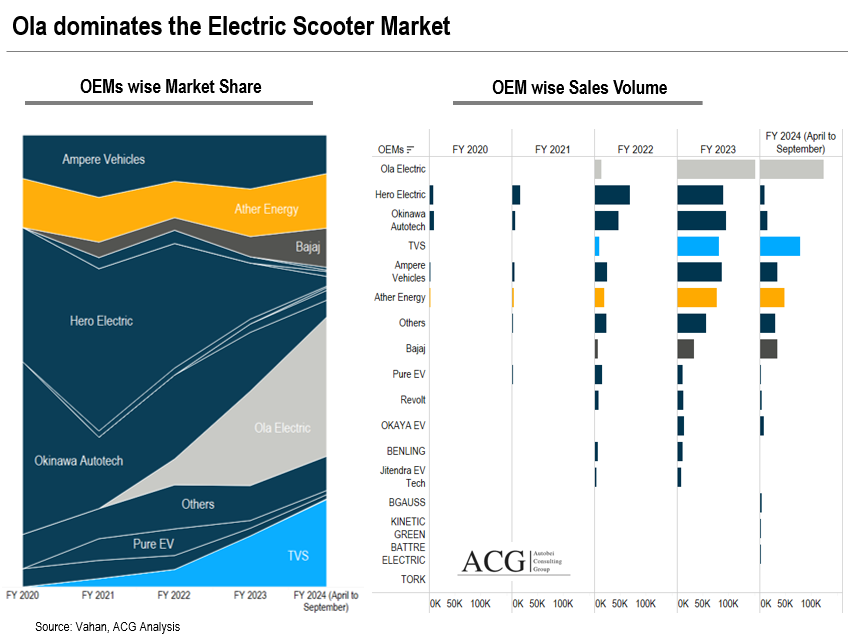
In the EV Segment, prominent contenders include Ather, Bajaj, Ola, and TVS. Notably, Chetak has witnessed a remarkable doubling of its market share within just one year, reflecting significant growth.

Indian Electric Two Wheeler Value Proposition

Particularly, Ola stands out as the fastest-growing OEM in the EV segment, commanding an impressive 30% market share during the initial half of FY 2023.

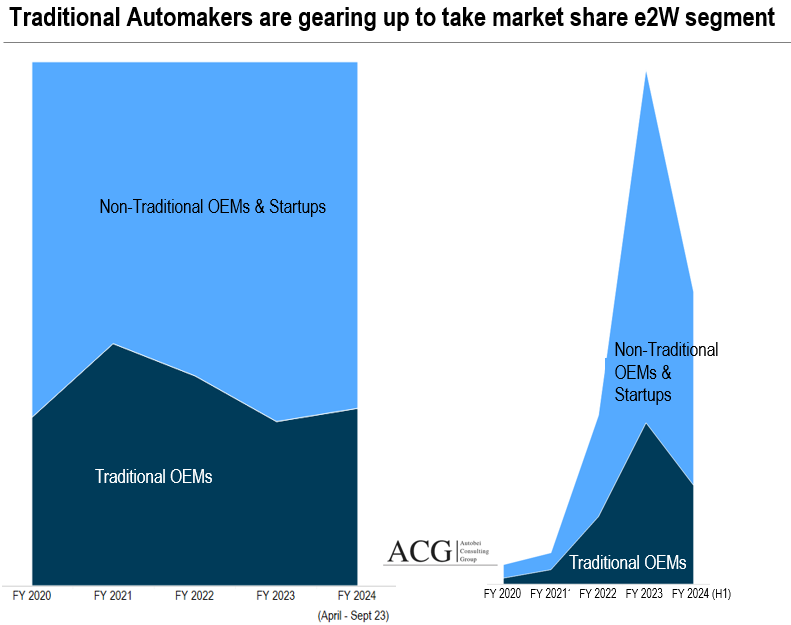
Traditional Automakers Paving the Way:
TVS has displayed commendable growth on the traditional automaker front, securing a 19% market share in H1 FY 2024, a substantial increase from 11% in FY 2023.

Challenges and Downturns:
Conversely, Hero Electric is gradually ceding its market leadership position, experiencing a significant 27% decline in market share from FY 2020 to H1 FY 2024, marking a substantial setback for the company. Additionally, Okinawa is another OEM witnessing a decline in market share, plummeting from 38% in FY 2020 to 3.6% in H1 FY 2024. Notably, two company dealerships in Ahmedabad have ceased operations.

Electric Two Wheeler Market Share 2023

New Entrants Shaping the Market:
When juxtaposed with traditional automakers, new entrants in the EV sector exhibit a stronger foothold in the Electric Two-Wheeler market, drawing parallels with the narrative of Tesla.

Customer behavior is sounding the alarm for heritage brands

Exploring Sales Trends:
Now, let’s delve into the factors that underlie these sales trends. We have meticulously studied and correlated consumer behavior within this purchasing pattern with market dynamics. By delving into the minds of existing and potential consumers, we unveil the driving forces behind these trends.

Cracking the Code of Consumer Decision-Making:
In the world of Electric Two-Wheelers, understanding how consumers make choices is crucial, when people are asked about the first brand that pops into their minds in the Electric Two-Wheeler category, a whopping 75% swiftly named Ola.

Ola Electric Scooter Customer profile

Among these, 75% and 30% attribute their choice to an emotional connection with the brand. This emotional bond is forged through Ola’s consistent storytelling, especially its impressive tale of having the largest manufacturing facility in India and the grand launch of the Ola S1 Electric Scooter. Ola also effectively leverages social media and extensive media coverage to cement itself as the go-to brand for tech-savvy, youthful, and creative individuals. Ola’s ability to influence consumer behavior is a testament to its brand strength, highlighting the idea that buying an Ola Electric Scooter transforms you into a hero, not just a purchaser.

When consumers have to choose between brands like Ola, TVS, Chetak, Okinawa, Ather, and others, their choice often reflects their personal identity and the image associated with the Electric Scooter they want to own.

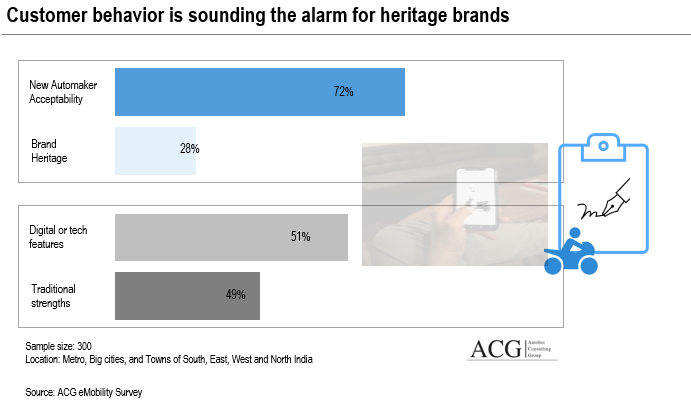
Interestingly, Ather users respond very positively, while users of some other brands express a more neutral sentiment. If this pattern continues, consumers might unconsciously lean toward specific brands drawn by the self-expression they find within them. This poses a significant challenge to traditional two-wheeler manufacturers.

Deep customer understanding helps OEMs create product roadmaps

The challenge for traditional Scooter Original Equipment Manufacturers (OEMs) is to shift from being seen solely as providers of Internal Combustion Engine (ICE) and Electric Two-Wheelers. This shift might involve introducing new brands that strongly emphasize Electric Technology, a move that significantly shapes consumer perceptions.

Oreva electric Two Wheeler Customer segment

Product Transformation: ICE vs. EV:
Traditionally, Two-Wheeler buyers sought high performance, safety, and mechanical reliability. But in the digital age, riders demand a more comprehensive experience – a brilliant, connected ride that enhances safety, provides information, and entertains.

Electric Two Wheeler and ICE Two Wheeler Transformation

In the coming years, there is expected to be a significant rise in electric two-wheelers equipped with extensive LCD dashboards and augmented reality head-up displays.

Sales and Marketing: Dealership vs. Online:
Customers usually start their journey online to gather information about Electric Two-Wheelers, but the final decision often hinges on a test drive. Research reveals that Electric Two-Wheeler buyers interact with an average of 5 touchpoints during the purchase process, with 3 of them happening online. These touchpoints significantly influence the buying decision, even though the purchase usually takes offline.

Enhancing the Showroom Experience for Customers:
The quality of a customer’s experience in an Electric Two-Wheeler dealership is crucial. Unfortunately, the current scenario leaves much to be desired, with 95% of customers reporting subpar experiences upon entering such showrooms. Prospective Electric Vehicle buyers deserve a showroom visit that exceeds traditional standards. It’s not just about the dealership’s size; it’s about creating a welcoming atmosphere, providing in-depth product knowledge, offering informative test drives, sharing technological insights, and showing an unwavering commitment to understanding each customer’s unique needs. Currently, Electric Two-Wheeler showrooms often fail to deliver an experience that matches the importance of the purchase, making it feel more like buying everyday products like soap or vegetables.

Dealerships must aim to exceed customer expectations aiming to boost customer satisfaction. This ultimately leads to more sales and helps build strong, lasting customer loyalty. Achieving this requires punctuality, personalized attention, and making every customer feel like they are the dealership’s top priority.

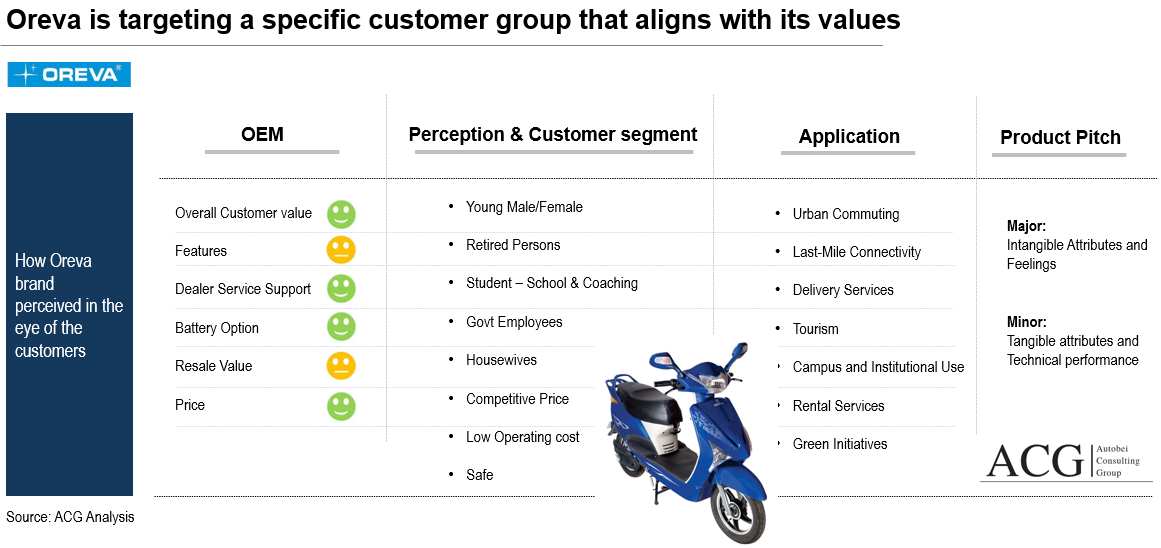
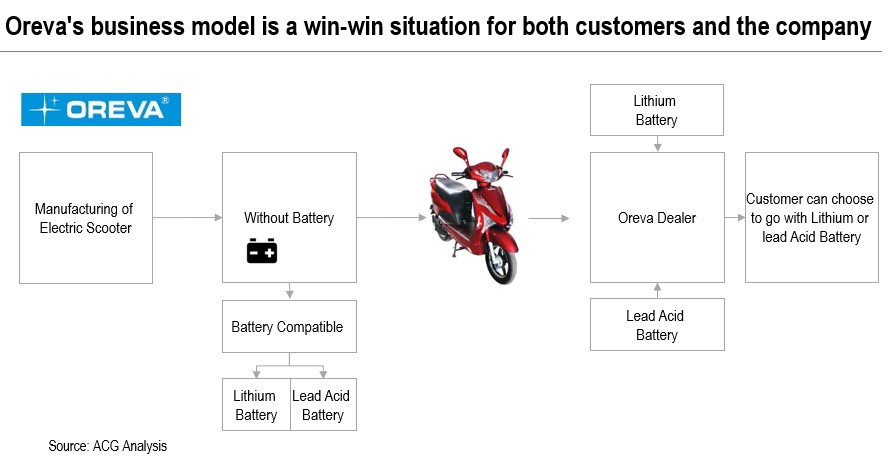
Oreva sets an example of understanding customer needs through a unique business model. Oreva manufactures Electric Scooters without batteries and actively involves dealers in the process.

Oreva's business model is a win-win situation for both customers and the company

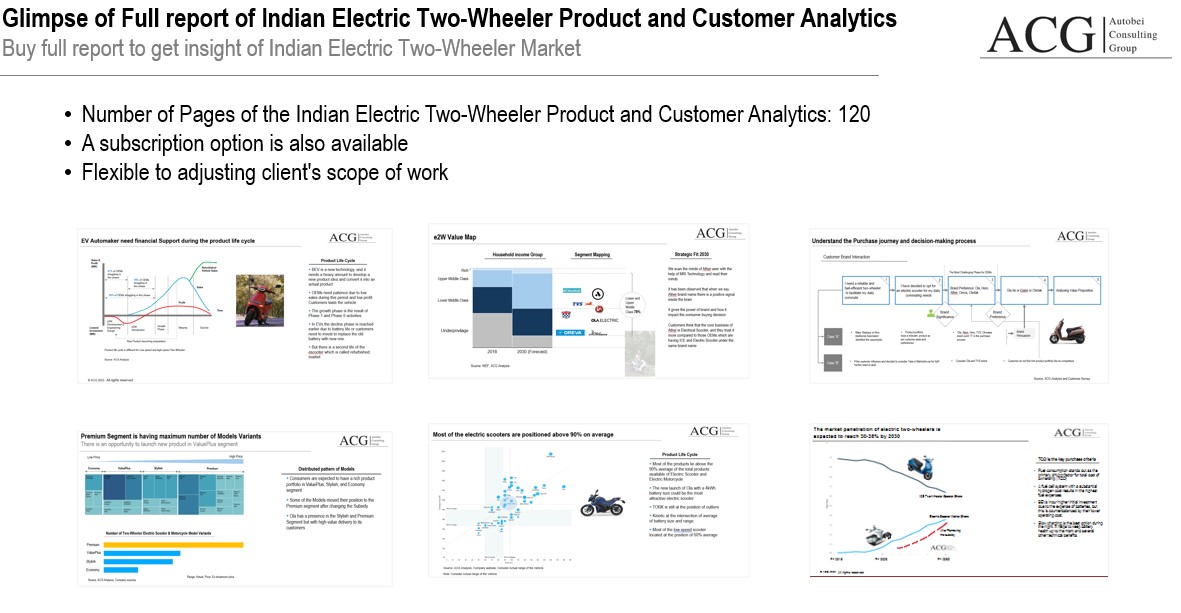
Key Highlights of the Indian Electric Two-Wheeler Product and Customer Analytics Report:

  • Indian Two Wheeler Market Size, Challenges, and Opportunities
  • Indian Electric Two-Wheeler Market size in terms of Volume (units) and Value (USD)
  • OEMs Market Share Trend and Forecast
  • Market size and trend of South, North, West and East India
  • Indian Electric Two Wheeler competitor landscape
  • Penetration of Electric Scooter and Electric Motorcycle till 2030
  • Electric Two-Wheeler Price Trend Forecast Analysis
  • Electric Scooter and Electric Motorcycle Market Assessment
  • Low-Speed and High-Speed Segment Analysis
  • Market category based on battery type: Lithium & Acid lead
  • Electric Two-Wheeler Model-wise Technology Analysis
  • Market Drivers and Restraints for Electric Two-Wheeler
  • Market dynamics in Rural and Urban areas
  • Expected Market Development for the next 10 years
  • Central & State Government Policy and Subsidy support Analysis and its impact on the Electric Two Wheeler market
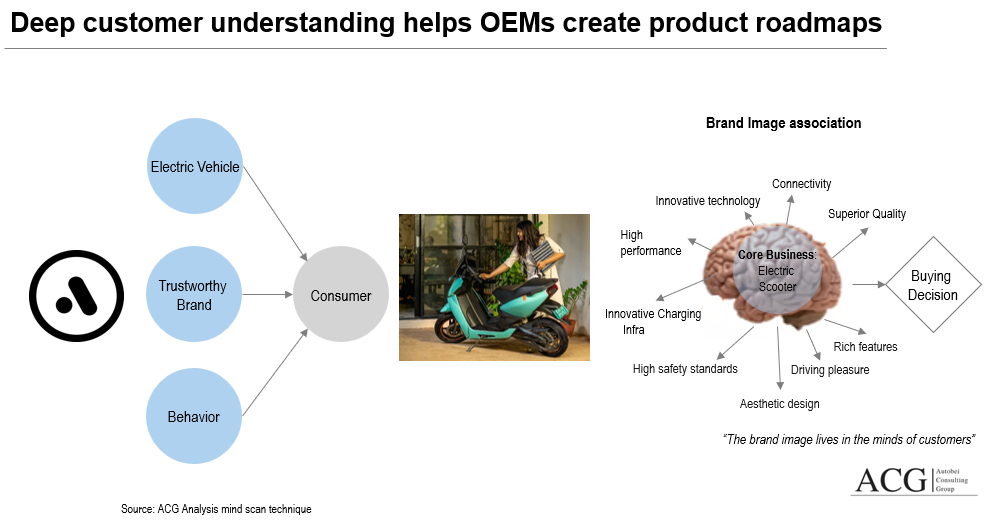
  • Electric Two-Wheeler Product Roadmap
  • Market Segmentation based on Volt 48-59V, 60V-72V and above 72V
  • Market Segmentation based on Battery size, Actual Range, and Charging time
  • How OEMs target customer segments and map with their product portfolio
  • What is the brand image and brand position in the eyes of the customers?
  • How to improve the brand position of Traditional and Non Traditional OEMs
  • Customer decision process – Electric Vs ICE Two-wheeler
  • Customer Groups for Electric Two-Wheeler
  • Customer journey touchpoints
  • What are the key points customers consider when buying an Electric two-wheeler?
  • Why Motorcycle customer is not taking an interest in replacing their ICE Motorcycle
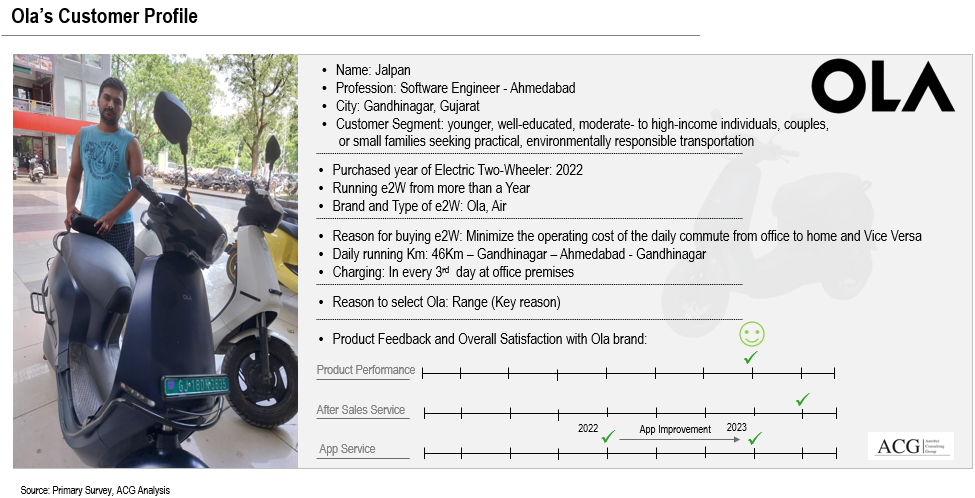
  • Customer profile of existing and potential users of e2W
  • Customer groups based on their income
  • Customer willingness to pay for different Brands and Models
  • Company Strategy Analysis, Investment, and company profile: Hero Electric, Ather, Ola, Crompton Greeves, Bajaj, TVS, Battre, Okinawa, Pure EV, Tork, Revolt, Oreva, White Carbon, BGAUSS, Kinetic, and others
  • OEMs Pricing Strategy
  • Price position or price difference of all Electric two Wheeler models
  • Segmentation based on the Price group of the Electric two-wheeler
  • Market and Product Gap Analysis
  • New coming-up launches
  • How Models deliver value to its customers
  • Product Life Cycle Analysis of Electric Two-Wheeler
  • Financial challenges during each phase of the Product life cycle
  • How to Develop the Electric Vehicle (2W) – balance between market attractiveness, Product attributes (MVP), and customer expectation
  • Design an effective Marketing Strategy
  • Sales Strategy Analysis
  • Digital Marketing Strategy Analysis
  • Customer experience analysis during Dealer visits and After-sales
  • How to Go-To-Market
  • Effective communication strategy since Electric Two Wheeler is the new technology
  • Dealer Staff training requirement
  • Refurbished market size and opportunity for all stakeholders
  • Refurbished feasibility study

The primary obstacle to electric vehicle adoption among the general public is the high price tag. Reducing costs is an ongoing process in the electric vehicle manufacturing industry, and ACG has been actively involved in this effort. Our goal is to examine how original equipment manufacturers (OEMs) and Tier 1 suppliers can achieve substantial cost savings, amounting to millions of Euros, by simply adjusting their purchasing approach for semiconductor components used in power modules.

Semiconductor Procurement Strategy

At the moment, Power Module (Which does not have its own Semiconductor ) companies acquire SiC Semiconductor chips from semiconductor manufacturers like Wolfspeed, Renesas, and others. They then use these chips as the heart of their Power Modules in terms of technology, and these chips also account for a substantial part of the module’s production cost.

  1. Direct Deal with Semiconductor Suppliers:

Electric vehicle Systematic Approach in Semiconductor Procurement

In this straightforward process, a pricing competition is at play. Power Module companies purchase chips and then resell them to OEMs or Tier 1 Suppliers through Power Module Packaging, making substantial profits solely through semiconductor trading. Consider this: there is a possibility for OEMs or Tier 1 Suppliers could save up to remarkable 500 million Euros depend on 2 Wheel Drive or 4 Wheel Drive/High performance Electric Vehicle. Exceptionally, The number of power modules used in a 2-wheel drive (2WD) or 4-wheel drive (4WD) vehicle can vary depending on the specific design of the electric powertrain and the vehicle’s power requirements

Consequently, Electric Vehicle startups, often find themselves negotiating terms set by these Power Module companies.

There are additional advantages to this approach. Payment terms can be more easily negotiated with direct chip suppliers. Moreover, OEMs and Tier 1 Suppliers gain direct control over chip quality, stay informed about new developments, and can discuss changes in technical requirements, such as chip size or power density.

Benefits of Direct Deal with Semiconductor Suppliers:

OEM and Tier 1 Suppliers Benefits of dealing with Semiconductor Suppliers Directly

Another avenue to save an extra million Euros in the realm of Power Modules is by abstaining from investing in Power Module production lines. Some Power Module manufacturers might face financial limitations, prompting them to seek investments from Tier 1 or OEMs, which typically involve a substantial sum, around 7 to 10 million Euros. However, it’s crucial for any business to avoid venturing into a risk-sharing business model, as customers should not be exposed to such risks. The decision about how much risk to undertake should rest with the Power Module companies.

2. Do not invest in Power Module Production line on the basis of risk sharing Business Model:

However, OEMs and Tier 1 companies can extend their support to Tier II Power Module companies seeking investment for establishing production lines or preferring to buy semiconductors directly from Power Module companies. OEMs and Tier 1 companies can facilitate the direct procurement of semiconductors from semiconductor manufacturers by Power Module companies, thus easing their financial burdens.

A considerable number of semiconductor suppliers have already ventured into the power module sector, while others are actively exploring opportunities to enter this industry. This has led to competition between semiconductor suppliers and power module manufacturers. Consequently, there’s a possibility that power module companies may not receive the most advantageous price offers from semiconductor suppliers. Although some power module companies claim to get the best semiconductor prices, it may not always be accurate. Therefore, it’s a better idea for OEMs and Tier 1 suppliers to directly negotiate with semiconductor suppliers to ensure they obtain the most favorable pricing.

Another crucial factor that companies should give serious thought to before engaging with Power Module manufacturers is the necessity of signing a Non-Disclosure Agreement (NDA) with a stringent and robust clause. An illustrative case is One of the leading OEM interaction with a Power Module manufacturer in Europe. This leading OEM shared its distinct design and advantages with the Power Module manufacturer, but ultimately, no agreement was reached on closing the deal. Subsequently, the Power Module manufacturer made some minor alterations to OEM’s design and began selling it to other OEMs and Tier 1 suppliers. This situation resulted in significant losses this OEM.

3. Use Si Semiconductor:

The third cost-saving method involves not using Silicon Carbide (SiC) in the power module device and opting for Silicon (Si) IGBT semiconductor technology instead. While SiC is an excellent semiconductor with unique benefits, it tends to be more expensive.

Is SiC a better choice than Si Semiconductor for EV

The choice between SiC and Si can be determined by OEMs based on factors like the vehicle’s driving patterns or powertrain needs. There are ten critical areas where efficiency improvements are possible with Si semiconductors. By utilizing SiC, overall vehicle efficiency can be boosted by 5 to 10%, resulting in cost savings across fifteen vehicle components, as outlined below:

Electric Vehicle Energy Efficiency Analysis

Even a modest 1% improvement in energy conservation across the listed factors could lead to significant energy savings for electric vehicle (EV) manufacturers, equivalent to SiC Semiconductors’ consumption in EVs. The factors affecting EV efficiency encompass a broad research domain, considering the numerous variables that influence energy usage. Weather conditions, for instance, play a substantial role in energy consumption. Extremely cold temperatures can reduce energy usage by up to 37%, while a temperature of 40°C can extend the vehicle’s range by approximately 2%. Similarly, the presence of headwinds significantly impacts energy consumption, requiring more energy to overcome resistance during motion. Weather conditions also interact with auxiliary systems, with research indicating that heating a vehicle consumes more energy than cooling its interior.

Additionally, factors like vehicle load, battery weight, and driving style all exert an influence on energy consumption. Heavier loads and increased battery weight contribute to higher energy consumption, while aggressive driving, including sudden and frequent acceleration, can lead to faster battery depletion. It’s vital to recognize that optimizing energy efficiency necessitates considering a multitude of variables, as electric vehicles often operate under less-than-ideal conditions, such as varying temperatures, wind, passenger loads, and traffic conditions.

Key Highlights of the Full Report:

  • Procurement Strategy Analysis with use case of SiC and Si
  • How OEMs and Tier 1 can save millions of Euro by adopting right strategy
  • Power Module Manufacturing Strategy and making profit by just trading semiconductor chips
  • How make the vehicle equivalent energy efficient without using SiC chip
  • Power Module Cost Structure
  • Long term benefits Analysis with Power Module buying Strategy
  • Power Module Business Model
  • Benefits Analysis of Direct dealing with Semiconductor Suppliers

ACG Electric Mobility has released the Global Electric Vehicle Data. China, Europe, India, USA, Japan, South Korea, Australia, and Rest of the world. The data gives insight into the Global Electric Vehicle. The Data is useful for Vehicle Manufacturers,  Component Manufacturers, and Consulting Firms,  Government for policy makers, Charging Infrastructure,  Electricity Planning organization, The data has been also categorised based on Vehicle Type:

  • Electric Passenger car
  • Electric Commercial vehicle – LDT, MDT, and HDT
  • Electric Bus
  • Electric Two Wheeler
  • Electric Three Wheeler

The following Data has been covered: Time Period – 2015 to 2030

  • Region-wise EV Sales from 2015 to 2030.
  • Global Annual Passenger Vehicle Sales (in Units) by Drivetrain – Battery Electric vehicle, PHEV, Fuel Cell, and ICE
  • Total Fleet by Drivetrain
  • Global Share of Annual Passenger Vehicle distance travelled by Drivetrain
  • Region (Global) wise Passenger Vehicle Fleet – China, Europe, US, India, Japan, Australia, South Korea, and RoW
  • Fleet Types: Annual Kilometres travelled by the passenger vehicle – Private Vehicle, Shared Vehicle, and Robotaxis
  • Region-wise Current Electric Bus Sales and Forecast
  • Combined Electric Two Wheeler and Three Wheeler Fleet

Vehicle Travelled by each segment and each region 

Global Electric Two-Wheeler Fleet Outlook

  • China
  • India
  • Indonesia
  • Vietnam
  • Pakistan
  • Thailand
  • Taiwan
  • Europe
  • Japan
  • USA
  • South Korea
  • Australia

Commercial Vehicle Sales by Drivetrain – Light Commercial Vehicle, Medium Commercial Vehicle, and Heavy Commercial vehicle: Battery Electric, Fuel Cell, Diesel & gasoline, and Natural Gas

Global Share of New Vehicle Sales with different Autonomous level:

  • ADAS/Level 2+ Automation
  • Robotaxis/Level 4+ Automation
  • Limited Autonomy features

USA, Europe, and China Passenger Vehicle Sales by Drivetrain:

  • Battery
  • Plug in Hybrid
  • Fuel Cell
  • ICE

Fleet average fuel economy for New Vehicle Sales in China:

  • CAFC Target
  • CAFC Actual

Vehicle Distance Travelled by Drivetrain in China, USA, and Europe:

  • Battery Electric
  • Fuel Cell
  • ICE

Vehicle Price and Volume of Passenger Vehicle Sold in US:

  • Small
  • Medium
  • Large
  • SUV

Total cost of Ownership of Medium ICEs and BEVs Cars in US and China

  • Types of Vehicle

Medium Segment BEV and ICE Pre Tax Prices (In USD) and share of battery cost in the US:

  • Vehicle
  • Power Train
  • Battery
  • Home Charger

Willingness to pay for EV at Different Price Point Data in Percentage:

  • USD 10.000 to 150.000

Plug-in -Hybrid and Battery Electric Vehicle Sales:

Energy Split Required Battery Electric Vehicle:

  • Home Charger
  • Slow Charger
  • Fast Charger
  • Work/Depot  Day

Global Electricity Demand by Vehicle Type:

  • Private car
  • Shared
  • RoboTaxi

Share of US households by number of vehicles:

  • 0 to 3+

Long Term demographic shifts that will impact new Passenger Vehicle Sales:

  • Low
  • Lower Mid
  • Upper Mid
  • High

By Age Group: Population:

  • <15
  • 15 to 69
  • >69

Population Shift – Urban Vs Rural

The Data is available in Excel Sheet.

The global hydrogen fuel cell vehicle market was estimated at $0.94 billion in 2022. Fast forward to 2040, and detailed analysis indicates an impressive growth trajectory, with the market anticipated to expand to a significant $80.4 billion. This journey will be marked by a steady Compound Annual Growth Rate (CAGR) of 28% from 2022 to 2040.

In this report, we are going to cover the main three technologies: Battery Electric Vehicles, Hydrogen Fuel Cells, and Hydrogen combustion Technology.

Market Potential:  The market potential is based on the Segment of the commercial vehicle. The long-haul segment was selected as the primary focus due to its significant volume and substantial contribution to emissions.MHD Global Market Forecast 2030

An analysis was conducted on three different configurations:

  • An example of the BEV Overnight Charging approach is Tesla’s practice of overnight depot charging using chargers.
  • Approach example most European OEMs charge overnight and regular breaks after 4 ½ hours of driving (750-1000 kW charger)
  • Fuel Cell generates electricity & battery as energy buffer

Introducing one of the most progressive frontiers in Commercial and Passenger Vehicle technology—Hydrogen Fuel Cell. As advancements continue to unravel, the trajectory points towards an initial embrace by Heavy Commercial vehicles, followed by the integration into the Cars and SUV segment. While the road is not without its challenges for fuel cell implementation, the march of improved technology holds the promise of transforming obstacles into opportunities, particularly catering to niche domains like Medium and Heavy Commercial Vehicles. A standout feature of fuel cell electric vehicles is their lightning-fast refuelling, a mere matter of minutes. Yet, as tradition would have it, the landscape of technological evolution is adorned with a series of challenges waiting to be conquered.Electric Truck Technology mapping with Truck type to Truck Application Analysis

The forefront of innovation witnesses the endeavours of New Hydrogen, as it pioneers a revolutionary technology directed towards the economical production of green hydrogen, leveraging renewable energy sources. Hydrogen, renowned for its status as the universe’s premier clean and abundant fuel, boasts a peerless attribute—emission neutrality—emanating only water vapour upon utilization. Unfortunately, Earth withholds pure hydrogen, compelling its extraction from hydrogen-containing sources. This paradigm shift in hydrogen production aligns with New Hydrogen’s quest for sustainable solutions, propelling a promising avenue in energy advancement.Achieving cost parity with diesel is not anticipated until 2030_ACG

  • Fuel consumption stands out as the primary driving factor for total cost of ownership (TCO)
  • A fuel cell system with a substantial hydrogen cost results in the highest fuel expenses
  • Battery Electric Vehicles (BEVs) incur higher initial costs primarily due to the expense of batteries, but this is counterbalanced by their lower ongoing fuel expenditures.
  • BEV (OVN) best ZE solution TCO – for LDT and MDT segment but battery life cycle still an issue

For a long history, the technique of splitting water into its elemental building blocks, hydrogen and oxygen, has been a longstanding scientific understanding. This process, facilitated by an electrolyzer, has, however, remained confined by its substantial cost. NewHydrogen now emerges as a vanguard of change, poised to engineer a series of innovative components that will pave the way for the dawn of an affordable electrolyzer generation. The company’s central mission revolves around the reduction and replacement of expensive rare earth materials. This strategic alignment echoes the grander ambition of catalyzing the advent of the green hydrogen age—a transformative endeavour forecasted by Goldman Sachs to burgeon into a market worth an astounding $12 trillion. The ensuing exploration delves into New Hydrogen’s journey of reshaping the electrolyzer landscape, becoming an instrumental part of the unfolding energy sector narrative.

Technology Comparison:

Long-Haul Heavy Duty with Different Technology

For emerging product categories like fuel cells, the holistic assessment of both ownership and operational costs emerges as a pivotal determinant in their path to commercialization. This assessment is intricately interwoven with the levels of functionality and performance they deliver, collectively steering the course of their market acceptance.

When evaluating the total cost of ownership for power systems like fuel cells, it involves considering several integral components. These components encompass factors such as fuel expenditures, additional operational costs like maintenance, and the initial equipment investment. Notably, the initial equipment cost significantly influences the competitive standing of fuel cells in the market landscape.

This report directs its focus towards hydrogen electrification via proton-exchange membrane fuel cells (PEMFCs). These fuel cells are widely acknowledged to have reached a state of commercial readiness, especially within the realm of automotive applications. Vehicles such as logistics vehicles, buses, and taxi fleets have very minimum reliance on hydrogen infrastructure, which makes them more viable and can be put to use.

Take a glance at how the inner things operate :

Fuel cell technology encompasses a diverse array of types, yet at its core, it consists of three fundamental components: an anode, a cathode, and an electrolyte. This amalgamation facilitates the seamless movement of ions—often in the form of positively charged hydrogen ions (protons)—across the cell.

At the anode, a catalyst instigates oxidation reactions within the fuel, giving rise to ions (predominantly positively charged hydrogen ions) and electrons. These ions traverse the electrolyte, journeying from the anode to the cathode. Concurrently, electrons embark on an external circuit from anode to cathode, culminating in the production of direct current electricity.

The cathode, in turn, is home to a distinct catalyst that triggers a reaction involving ions, electrons, and oxygen. The outcome is the formation of water and, potentially, other secondary products.

While the generation of electricity is a primary output, fuel cells also produce valuable by products—water and heat. Depending on the fuel source, there might also be trace emissions, like minimal quantities of nitrogen dioxide.
Efficiency in fuel cells typically hovers between 40% and 60%, with a potential for remarkable upticks to around 85% if waste heat is harnessed through cogeneration mechanisms.

Shifting the spotlight onto hydrogen fuel cell vehicles, they utilize hydrogen fuel cells to power their electric motors. The process involves activating the fuel cell with hydrogen, leading to the generation of electricity. What distinguishes these cars is their potential to greatly reduce emissions in transportation, in sharp contrast to conventional diesel and gasoline vehicles that emit greenhouse gases while operating.

Prominent companies such as Bosch and Nikola are dedicating significant resources to drive the expansion and profitability of this technology. Concurrently, BMW is heavily involved in the development of hydrogen fuel cell automobiles. Japan is preparing for large-scale hydrogen vehicle production, while India is actively investigating hydrogen fuel cell technology, receiving substantial investments from Reliance and Adani. Successful trials have been conducted with vehicles like BharatBenz Buses and Ashok Leyland vehicles. The Ministry of Transport has undoubtedly taken notice of all these advancements in the field. These developments have propelled them into a phase where they are willingly spearheading efforts to thoroughly explore hydrogen fuel cell technology and implement essential measures to drive its progress in the days ahead.

Key Highlights of the Full the Report:

  • The Potential market size of the battery Electric Truck and Hydrogen Fuel Cell
  • Technology Roadmap of components suppliers like Battery, Motor, Inverter, Axle, Power Module, Semiconductor, and Technology Topology
  • New Technology Development Analysis and Forecast
  • Regions included: USA, Europe, China, and RoW
  • Key OEMs in manufacturing of Electric vehicle and Fuel cell – Daimler, MAN, Iveco, DAF, Scania, Nikola, Paccar, Volvo, Volta, Tesla, Geely
  • Technology requirement and challenges
  • Charging and Hydrogen fuel pump Infrastructure requirement
  • Mapping the Technology feasibility to sub segment of heavy Commercial Vehicle like Light Duty Truck, Medium Duty Truck, Heavy Duty Truck, Tipper, Long Haul, Special Application, City Bus
  • Technology to application of the Truck and Bus suitability
  • Component Suppliers or stake holders Analysis
  • Truck architecture and component functions Analysis
  • Cost Analysis of the vehicle
  • Comparison between establish and Startups OEMs in this segment

Electric vehicles have captured widespread attention and become an extremely alluring sector for Original Equipment Manufacturers (OEMs), customers, suppliers, governments, and a broad spectrum of stakeholders.

The electric car market is experiencing a remarkable surge, with sales surpassing 10 million units in 2022. Electric cars accounted for 14% of all new car sales in that year, marking a significant increase from approximately 9% in 2021. The first quarter of 2023 witnessed the sale of over 2.3 million electric cars, showcasing an impressive 25% year-on-year growth. Projections suggest that sales could reach ~15 to 16 million units by the end of 2023 with the support of government subsidies.

The electric vehicle industry’s expansion is fuelled by various factors. The convergence of the supply chain and technology is progressing steadily, although a noticeable gap persists between the availability and demand for essential EV components, including semiconductors, inverters, and power modules. As a result, EV OEMs and suppliers have acquired valuable understanding regarding the challenges, technology maturity, and the roadmap for advancing electric vehicles.

Top Electric Car Market Share Europe China and USA 2023 Q1

Tesla is a prominent and influential player in the electric vehicle industry, constantly adapting its approach to broaden its market share. While Tesla was relatively not that famous in the past, today, all conventional automakers are embracing elements of Tesla’s technology and business model. A noteworthy breakthrough by Elon Musk is the introduction of the Discrete Power Module, which not only cuts costs but also ensures a smooth and uninterrupted supply of power modules for their electric car line-up.

The electric vehicle segment poses a challenging phase for German OEMs as they strive to maintain their market share, not only in their domestic market but also in key regions like China and the US. This situation significantly jeopardizes the longstanding European legacy in the automotive industry.

Electric Car Product Position in Europe region

The business strategy utilized by established OEMs and suppliers:

A considerable number of OEMs and suppliers have set up separate departments within their organizations to cater specifically to the electric vehicle (EV) market. Initially, the financial attractiveness of this vertical may be limited due to the substantial initial investments and uncertainties related to technology development.

The strategy for achieving a suitable product-market fit for electric vehicles (EVs):

Numerous new models from major OEMs are currently in the development pipeline, driving the growth of the electric vehicle (EV) industry. The strategic planning of EV products plays a pivotal role in both defining the industry’s expansion and fostering the overall business growth of OEMs. During the initial phase of electric vehicle product launches, Luxury, Premium, and SUV models are dominating the markets in Europe and the USA. In contrast, the Chinese EV market has already experienced significant growth in the small electric car segment during its first phase, with the Economy EV segment now prevailing in China. Although the Electric Vehicle Subsidy in China concluded in 2023, there were still local-level subsidies available to a limited extent. Recently, the Chinese government decided to extend the EV subsidy until the end of 2027, with one of the reasons being to provide continued support to the country’s economy.

Electric Car Price Analysis of European Market

In a bid to promote the adoption of premium electric vehicles, the Chinese government is actively encouraging a shift in the electric vehicle (EV) market. As part of their policies, tax waivers for high-end EVs will continue, but there will be a cap of CNY30,000 during 2024 and 2025 for vehicles priced above CNY339,000. This unexpected extension of the waivers is expected to alleviate concerns among local automakers, providing them with an incentive to explore and invest in premium EV brands. Moreover, it serves as a significant motivator for traditional luxury car manufacturers to expedite their transition towards embracing EV technology. In the following years, the cap will be further reduced to CNY15,000 in 2026 and 2027, broadening its impact to encompass a wider range of EV models.

European car manufacturers are actively engaged in developing economical electric cars to introduce to the European market. Among them, VW stands out as a proactive player, determined to establish its presence in the EV segment. Additionally, Peugeot, Citroen, and Renault have ambitious plans to launch their own cost-effective electric car models by 2024. These upcoming vehicles are set to utilize Si IGBT technology, enhancing their performance and efficiency. Moreover, renowned brands like Mercedes and BMW are placing their faith in the 3-level switch technology, which is anticipated to offer a significant 4 to 5% improvement in efficiency compared to the conventional 2-level switch technology.

Electric Car segment wise Analysis and OEMs Electric Car Strategy

There are five key technological attributes that significantly influence electric vehicles:

1. 400V Vs 800V architecture
2. Si and SiC Semiconductor
3. Battery Type – Li comes with other types of metals
4. Motor efficiency
5. Overall vehicle Efficiency

The data underscores the prominence of the 400V architecture as the primary choice, with the 800V architecture offering quicker battery charging capabilities.

400V and 800V Electric Car Trend Analysis

There is straightforward correlation between an electric vehicle’s range and its price.

Most Energy Efficient Electric cars
Among electric vehicles, Tesla’s Model S and Model Y stand out as prime examples of exceptional efficiency, providing customers with a highly attractive proposition. Equally noteworthy, Hyundai’s IONIQ model features a meticulously developed and efficient e-powertrain, adding to the array of top-performing electric cars available to consumers.

Here are some key highlights of OEMs’ strategies:

BYD is making substantial strides in the $10,000 USD electric car market, establishing a strong foothold not only in China but also in other targeted markets, where it enjoys an impressive 60% market share. In a bid to strengthen its position in the electric vehicle segment, Volkswagen (VW) has made a bold move by investing $700 million in start-up XPeng, acquiring a 4.99% stake, and forging deeper cooperation with SAIC. These strategic endeavours highlight the OEMs’ commitment to the evolving electric vehicle landscape.

The electric vehicle market classifies its models into distinct segments based on price and power specifications. Within the economy segment, there are entry-level models priced below Euro 30K, equipped with 250kW power and utilizing IGBT technology. Meanwhile, vehicles falling within the economy segment boast a range of 400km or more, and those surpassing Euro 60K are categorized as premium car segment offerings.

In terms of technology strategy, Chinese OEMs are actively exploring the feasibility of implementing 400V architecture with SiC technology, while their European counterparts are adopting different approaches in their pursuit of advanced EV technologies.

Tesla’s innovative influence spans across various markets, where it is at the forefront among Original Equipment Manufacturers (OEMs). Not only has Tesla taken the lead in the vehicle sector, but its impact extends to the component level as well. A prime example of this is Tesla’s pioneering adoption of Silicon Carbide (SiC) in Power Modules. Observing Tesla’s successful integration of SiC technology, other manufacturers have swiftly followed suit, embracing this cutting-edge material in their own products. This trend highlights Tesla’s position as a trailblazer, setting new standards and prompting industry-wide advancements. As a result, Tesla’s forward-thinking approach continues to shape and elevate the automotive and tech sectors, inspiring further innovations and fostering healthy competition among OEMs.

In the ever-accelerating race towards automotive innovation, Tesla is at the vanguard, harnessing cutting-edge heat pump technology to extract thermal losses while Stellantis forges ahead with their ingenious Intelligent Battery Integrated System (IBIS), channelling direct AC power to the battery. These advancements redefine efficiency, unveiling a new era of cost-effectiveness, spatial ingenuity, and lightweight prowess.

As the EV landscape unfolds, some narratives point to China as the frontrunner, with European and American counterparts appearing to lag behind. However, let us view this spectacle not as a static snapshot but as a thrilling relay of progress. China may be leading in this exhilarating lap, but the next leg of the EV journey promises exhilarating twists, turns, and formidable competition from all corners of the globe. The finish line is far from reached, and the world eagerly awaits the thrilling crescendo of the next round of EV evolution.

Reimagining Charging Infrastructure:

The landscape of charging infrastructure presents numerous challenges, particularly from a customer perspective. However, strides have been made in Europe, China, and the US to enhance accessibility, especially for apartment dwellers. Leading the charge in this domain is Tesla, with its cutting-edge charging infrastructure that seamlessly supports both Slow and Fast charging using a single, versatile charger.

Electric Car fast Charging time in Europe

In the quest to develop a comprehensive network, companies like ABB, EVBox, Scheider Electric, Siemens, BP, and Shell are diligently working to establish a dense charging presence. While progress is evident, there remains a significant opportunity to further refine charging functionality and introduce innovative features, driving the widespread adoption of electric vehicles.

An essential aspect of this transformation is the standardization of charging plugs. By defining a universal version, customers can enjoy a hassle-free charging experience across diverse points, making electric vehicle charging an effortless and convenient reality.

The Indian Truck market is one of the most attractive markets that has been a focal point of the development of many Foreign truck manufacturers. European players are busy occupying their position & space within the market, and various Asian including Chinese manufacturers are evaluating the potential of this segment.

Statewise Truck Strategy Analysis

The rigid Haulage segment is the biggest truck segment, Tipper is the normally profitable segment and Tractor is a growing segment in India. The key driver of the segment is E-Commerce growth, New Construction, Overall positive sentiments in the Macro Economy, road infrastructure and long-distance transportation of commodities will experience positive growth.

In general, trucks can be divided into Premium, Medium Budget, High Budget, and Low-Cost segments, considering the key role of Customer buying trends, OEM’s product quality, and spare parts manufacturers. Every Zone and state has different market dynamics which needs to be understood and create a strategy accordingly.

Statewise India Truck market Analysis and Forecast

To succeed here, one must understand the state-wise dynamics since every state is diverse in terms of Customer Behavior, Nature, Type of Business, Language, Financing, Type of Industry, State Policies, Tax etc. The complexity could be compared to China.

Report Highlights:

GVW wise: Mini, Pickup, LDT, MDT, and HDT

– Type Wise: Rigid Haulage, Tipper and Tractor

Category: Small Truck, LDT, MDT & HDT

  • State-wise Volume in units and in terms of value
  • States covered – MP, Chattisgarh, Gujarat, Maharastra, Rajasthan, Karnataka, Kerela, Tamilnadu, Andhra Pradesh, Goa, Delhi, Haryana, Uttar Pradesh, Uttarakhand, Himachal Pradesh, J&K, Assam, Punjab, West Bengal, Bihar, Jharkhand, and Odisha.
  • OEMs Covered – Tata Motors, Ashok Leyland, Mahindra, Force, Maruti Suzuki, Eicher, Volvo, Scania, and BharatBenz.
  • Truck Segment Analysis – Tractor Trailer, Tipper, and Rigid Haulage
  • Key Truck Models, Price, and technical specs
  • Key Growth Drivers in each state
  • State-level Sales Outlook
  • Region and state-wise Trends and forecast
  • OEMs Presence, Volume, Market share forecast
  • State-wise mapping of market dynamics, Product & Brand Suitability
  • Truck Application Analysis
  • Fleet Owners Truck Customer Behavior Analysis – Small, medium, Large truck operators, and Municipal
  • Truck Type Sales Analysis
  • Other Industry Analyses like Construction, Logistic, E-commerce, Mining, Engineering, Manufacturing, Chemical, and others
  • Dealer Network analysis
  • Technical Analysis of Trucks
  • Case study of MAN, BharatBenz, Tata Prima, Volvo, and Scania


The power module is one of the key components of an Electric Vehicle. A power Module is a combination of Semiconductor Technology and packaging technology. Semiconductor manufacturers are also started to enter into Power Module Business due to the high demand for the component.

The Power Module market is defined into 3 major categories – Moulded Halfbridge Power Module, 6P, and Discrete Power Module. 6P architecture is in demand due to its benefits. Nowadays a customers are(OEMs, Tier I) expecting One Power Module device which suits their 400V and 800V vehicle architecture with the same size and dimensions.Electric Vehicle Power Module Application Analysis

Currently, 3 major key markets are looking fit for Power Module China, Europe, and the USA. The market size of Power Module will touch $16.2B by 2030 with a CAGR of between 14 to 16% from 2023 to 2030. The growth of the Power Module Business depends on several market Dynamic factors like the Type of Power Module, and the Electric Vehicle Market growth. The availability of semiconductors is also going to play a role. Other factors which affect the market’s size and growth are the semiconductor’s price trend, Yield loss, Electric Vehicle Type, New Technology development, and Acceptance of discrete devices. In our report, we have examined each point in detail and its impact.

We Analysed the Power Module packaging material Technology Trends, Innovation, and Price fluctuation like Baseplate, Semiconductor chip, Copper, Silver, Substrate, Mould Material, Wire Bonding machine, Test machine, and Logistic cost.

Tier 1 Suppliers, OEMs, and Power Module are looking to control the manufacturing cost. Another key challenge is the forecast methodology of the Power Module included every cost component for the next 10 years.

The key selling factors of the Power Module are High Energy Density, Size, Weight, Ease of installation, Thermal loss, peak temperature performance, Cost Vs Benefits, and maturity of the Technology for Silicon carbide. However, there is a high-cost difference noted between Si and SiC technology. Both technology IGBT and MOSFET are suitable for different EV applications. Europe is leading in Si and SiC, the USA is sourcing the Power Module mainly from Tier I, and China is still struggling to source IGBT locally.

The electric vehicle Industry is expecting the top-side contacts to reduce thermal losses. New technology excludes the substrate material, replacing the aluminum lead frame. This change saves power Module costs.

For vehicles like SUVs, Trucks need highly reliable and robust power Modules. Some metals like copper and silver sintering have a heavy cost impact on Power Modules.

Process development is another challenge mainly for Power Module manufacturers, but other stakeholders are suffering due to process development.

Some Power Modules are with minor customization but are expensive. However, most of the Power Modules are following the Infineon Power Module design and pattern.

Key highlights of the report:

  • The market size of Power Module in terms of Value and Units – Trend and Forecast
  • Market Share Analysis of Power Module
  • Region-wise ( USA, China, Europe, and RoW) market size and Potential
  • Key Challenges and Key Growth Drivers
  • Power Module Competitor Analysis – Infineon, Hitachi, STMicro, Vitesco, ONSemi, Rohm, Bosch, StarPower, Mitsubishi, and others Cooling Technology Comparison
  • Number of Semiconductor chips per Module
  • Business Model Analysis – Semiconductor Chips, Power Module, or Inverter
  • Technology Challenges and Opportunities
  • Product – Market Fit Analysis
  • Risk Analysis

Automotive Component Price Data and Report is available in the Indian Market. There are 3 Vehicle segments and 3 component sub-segments have been defined in the database.

Vehicle Segment:

  • Passenger Car (Luxury, Premium, and Mass Market),
  • Truck (LDT, MDT, HDT, Tipper, TT, RH),
  • Bus (Light, Medium, and Heavy Duty buses)
  • Two Wheeler (Scooter & Motorcycle), and
  • Three Wheeler (Passenger and Goods carrier).

Electric vehicle parts or component price database is separate.

The components Types: OEMs genuine price, OEMs suppliers to the retail market, Local Suppliers, and Chinese.

The price database is based on a city-level intelligence Pricing database.

Filter, Electric components, Lubricants, Transmission, Engine, Brake, Steering, Tyre, Oil, Oil seal, Battery, Spark Plug, Switches, Lighting, Sound System, Interior items, Axle, Shock Absorbers, Windshield, Sensors, Inverter, Wiper blade,  Mirror, and others.

We have covered more than 100 components in our database.

  • The database is useful for the forecast of the Indian Automotive component market size in units and value.
  • Competitor Analysis of various Automotive suppliers of different segments
  • Launching a new product strategy
  • Vehicle level Cost reduction plan and improve TCO
  • Measure the operation cost analysis of the Vehicle

Customization:

We have two sets of the database:

  • Standard pricing database and
  • Customize Database

Standard Database with proper explanation of database give you quick access. The Customization database give you data as per your requirement. Both are beneficial for any organization.

Pricing is the most important parameter in the Auto Component business in India. Getting precise competitor pricing can change the business scenario of the company. This database help to design the pricing strategy, target customer segment, Business Growth, Business Planning, Marketing Strategy, Manpower & Material Planning, Launching New product and others.

Along with Data, ACG also offer Pricing Analytical service. This advanced analytics provide key insight of the data with data interpretation and explanation of trend and Forecast.

We have released Electric Vehicle data with critical information. This data is helpful for finding the historical and future trends, Product Position on various product and market parameters, Electric Vehicle Strategy, Product Gap, Competitor Analysis, Opportunity, and risk analysis.

It is beneficial for Electric Vehicle OEMs, batteries, Power modules, semiconductors, Inverters, Electric Motors, and electric drivetrain Suppliers suppliers.

The Region included: USA, Canada, China, and European regions like Germany, France, Austria, Netherlands, Denmark, Sweden, Spain, UK, Italy, and others.

Electric Car and SUV – Product attributes:

  • OEMs Name
  • Electric Car Model Name
  • Car Body Type
  • EV Platform
  • Power (In Kw)
  • Price
  • Sales Volume
  • Semiconductor Type – Si or SiC
  • Segment Name
  • Range (In Km)
  • Vehicle Architecture – 800V and 400V
  • Battery Type
  • Launch Date
  • Name of Country
  • Drive Type
  • Nominal Capacity kWh
  • Usable battery
  • Top Speed (km/h)
  • Charge Port
  • Charge Power (kW AC)
  • Fast charge Power (max) kW
  • DC Charge Time
  • Fastcharge Time (min)
  • Charge Speed ( km/h)
  • Fastcharge Speed (km/h)
  • Vehicle Consumption Wh/Km
  • Product USP

The data is available in Excel and also available in Analytical form.

When talking about the Chinese electric cars in Europe, our focus is not merely on their quality but would extend to other factors such as their ability to fulfill the aspirations of buyers, the Right set of Product attributes, their cost effectiveness, their cutting-edge features, the quality of the components used, and most importantly, their availability to customers all year.

Taking a look at the current trends leaves us with the impression that the Chinese BEV manufacturers are undergoing a rough patch owing to various issues, and this has surely hit their performance in the market and left them as a poor performers in the market circles.

But we are quite optimistic to see these brands growing big in the next few decades as far as central, eastern, and other parts of Europe are concerned. These market trends are not just restricted to the EV industry but even stretch to the overall brand reach of the OEM, tradition, nation, consumer interaction with the brand, inventory and overall supply chain model of transporting inverters and batteries, and the overall experience in terms of sales strategy and a market view of BEV.

In the present scenario, premium and mass car manufacturing companies around the globe like BMW, Porsche, Mercedes, Volkswagen, and Stellantis are the market leaders in the automotive sector in the European region. Currently, the brands from China are planning to make a giant leap into the European region with an eye on making the most of the opportunities available in the EV sector.

Well-known companies like BYD, XPENG, NIO, and MG have already knocked on the doors and made their way into the streets of the European nations. The valued growth projection for the next 3 years has some positive news for the Chinese brands, as these brands are anticipated to put up a great performance by amassing growth ranging between 17% and 20%. This so-called estimated growth projection has raised the eyebrows of all the contemporary giants of the European region. The rise of Chinese brands to be one of the powerhouses of the EV sector in the European region will bring about a tremendous change in the economic models and will even induce changes related to the current societal structure. One thing is for sure: the indigenous Chinese brands will spin their magical web in the European region sooner rather than later.

The Chinese brand’s rise to glory will add to the woes of the European EV market, which is already plagued with innumerable problems. This will truly worsen the existing job crisis in Automobile, dependent industry and push it into an irreparable position. The brands are also under the threat of suffering huge losses and letting go of the legacy they’ve built over the decades. Further, the loss is estimated at around 8 billion euros, and the GDP is expected to witness a steep dip. Alongside this, the creativity and innovation involved in manufacturing EVs will gradually come to a standstill as the attention of customers has now shifted to Chinese brands.

Various factors have contributed to this sort of unprecedented growth of Chinese brands in the EV market in the European region. Just a few years ago, the EV market in the European region was full of brands that were native to the country.

Analyzing the vital pointers that might have led to this kind of red carpet welcome for the Chinese brands reveals a few fascinating points, and a few of them are listed below:

The quality of the cars produced by the various Chinese brands is on par with the laid-out standards, which has enhanced their acceptable quality margins. The manufacturers have also ensured good inventory capabilities, which has opened the doors to cars being available across seasons. Also, the absence of vital differentiation factors in terms of the production of EVs with European manufacturers has added to the positives of Chinese brands. The Chinese brands have come a long way in the EV sector of the European region and are eager to replicate the flawless run that the German brands are having in the traditional ICE vehicle sector.

The nature of the consumerism model in the European region reflects that 30 to 40% of consumers are curious to get their hands on EV cars, irrespective of the brand’s origin. They are all set to own even the cars presented by Chinese brands if they are appealing in terms of performance and quality. While a major chunk of the audience is apprehensive about owning Chinese brands owing to various factors, the Chinese brands have taken cognizance of this issue and have instructed their think tanks to bring about a feasible solution to address it.

Product pricing is indeed a detrimental factor and is one of the core considerations for customers while purchasing. One might feel that the Chinese brands are much more affordable than the European brands, but that’s not true, as the pricing is fairly competitive and in line with European EV pricing. The Volkswagen and the BYD are all priced in the range of 50k euros. Similarly, NIO and Tesla are also priced in a fairly equal range.

Prominent factors have contributed to the unparalleled growth of Chinese brands in the European market:

Customer Sentiment: The customers of the European region have embraced the Chinese brands with open arms, thanks to the cutting-edge technology that the Chinese brands have imbibed in their products and also the best-in-class branding strategy that is put to use by them.

European Policy: Though the European policies are extremely stringent in countering various issues, they lack the proper procedural system that safeguards the interests of the indigenous manufacturers.

Product attributes: This factor has lived up to the expectations of the customers and will definitely contribute to the EV market’s broadening horizons.

European OEM design and quality: This is one of the prominent aspects of the EV market, and the manufacturers are compelled to come up with the vehicles while keeping in mind the bigger picture. Incidentally, the quality of the German Electric cars (As per some of the reports) has not been up to standard over the last few years, and they’re working to get things better. However, the South Korean and Japanese brands have carved names for themselves in the product sector and are well known for their superior quality.

EV technology: This segment of technology is in a very nascent stage, and all the contemporary giants in this field are making little progress every single day. So we can’t really zero in on one specific company that is good at this. This field also demands very superior hardware and software knowledge and skilled people. Hence, Germany has called for professionals to be very skilled in this domain to actually make it count.

Tesla Factor: This brand has entered the EV market like a thunderbolt and is reaping rich dividends in the European EV market. Germans OEMs do not face such tough competition in ICE vehicle segment.

Emotional affinity: The people of European countries are deeply inclined towards their indigenous brands and have always embraced the products produced by these brands. Local OEMs need to fulfill the customer’s expectations in a short span of time.

Miscellaneous factors: There are quite a number of pointers that will have an impact and contribute to the growth of the EV market in the European region. The advent of e-fuel has definitely altered the market dynamics and has proven to be a vital factor in bridging the existing space between the BEV market and the European OEMs. Geo-politics is also one of the important factors in EV games.

Overall, the European automotive market is facing numerous challenges, and it has to definitely find a way to tick these boxes at the earliest in order to stay firm and rooted amidst all the challenges posed by the new entrants and foreign brands.

The full report is available which included every aspect of EV, Europe, and China.

Every Indian state is having different market dynamics like Market Size, Forecast, Vehicle Application, Brand position, Product position, Sales Outlook, Customer buying habits, Culture, Languages, Economy and vehicle requirements.

ACG State-wise Indian Commercial Vehicle Market Report is a detailed report which has been prepared with quantitative and qualitative data analysis.

Report Highlights:

  • Indian Commercial Vehicle Overview and Macro Economy Analysis
  • Commercial Vehicle Trend and Forecast – By Volume and By Value
  • Truck and Bus Segment
  • GVW-wise Sales Analysis
  • Model-wise/ Brand wise  Production and Sales
  • State-wise Volume and Market Share
  • State-wise GDP Analysis
  • Price and Discount Analysis
  • Key Drivers of the Industry
  • Application and Industry Analysis
  • Product Analysis
  • OEMs Strategy Analysis
  • Case Study: MAN, Scania, and Tata Prima Product
  • Driveline Analysis
  • New Technology Analysis and Forecast

Table of Contents:

  • Indian Commercial Vehicle Market Overview
    • Economy
    • Market Size
    • Segment and Sub-Segment Overview
    • Major players
    • Key Market Dynamics
  • Executive Summary
    • Key Findings
    • Segment Overview
    • Historical & Future Trend
    • Industry Drivers
    • Regulatory Factors
  • Research Scope, Objectives, Background, and Methodology
    • Research Scope
    • Research Objectives & Aims
    • Research Methodology
    • Research Background
    • Key Questions this Study Will Answer
    • OEM/Stake holders Covered in this Study
  • Product Segment Analysis: Goods & Passenger Vehicle
    • Small/Mini Commercial Vehicle Segment Analysis
      • By Units
      • By Worth (USD)
      • Segment growth analysis
      • New Product launched analysis and its impact
      • Segment Share analysis
      • Segment Driveline analysis
      • Price bracket
      • Product Application wise analysis
      • After sales & factor analysis
      • After Sales Strategy and Challenges
      • After Sales Commercial vehicle trend
      • Used vehicle market analysis
      • Trend Analysis
      • Buyers category
      • Segment Dynamics analysis
      • Forecast
    • Light Commercial Vehicle Segment Analysis
      • By Units
      • By Worth (USD)
      • Segment growth analysis
      • New Product launched analysis and its impact
      • Segment Share analysis
      • Segment Driveline analysis
      • Price bracket
      • Product Application wise analysis
      • After sales & factor analysis
      • After Sales Strategy and Challenges
      • After Sales Commercial vehicle trend
      • Used vehicle market analysis
      • Trend Analysis
      • Buyers category
      • Segment Dynamics analysis
      • Forecast
    • Medium Commercial vehicle
      • By Units
      • By Worth (USD)
      • Segment growth analysis
      • New Product launched analysis and its impact
      • Segment Share analysis
      • Segment Driveline analysis
      • Price bracket
      • Product Application wise analysis
      • After sales & factor analysis
      • After Sales Strategy and Challenges
      • After Sales Commercial vehicle trend
      • Used vehicle market analysis
      • Trend Analysis
      • Buyers category
      • Segment Dynamics analysis
      • Forecast
    • Heavy Commercial Vehicle
      • By Units
      • By Worth (USD)
      • Segment growth analysis
      • New Product launched analysis and its impact
      • Segment Share analysis
      • Segment Driveline analysis
      • Price bracket
      • Product Application wise analysis
      • After sales & factor analysis
      • After Sales Strategy and Challenges
      • After Sales Commercial vehicle trend
      • Used vehicle market analysis
      • Trend Analysis
      • Buyers category
      • Segment Dynamics analysis
      • Forecast
    • Commercial Vehicle Product Analysis
      • Product segment wise market size
      • Application wise Analysis
      • Product Price Analysis
      • Product Type wise
      • Category wise analysis
      • Engine Specs analysis
      • Transmission specs analysis
      • Fully built option
      • Chassis option
      • Cabin & Chassis option
      • CV Product Gap analysis
      • Product USP analysis
      • Product Life Cycle – major Models
      • Market dynamics
      • Mapping of Commercial vehicle application and model
  • Commercial Vehicle Vehicle Type:
    • Tipper
      • Product portfolio
      • Key Models
      • Technical Analysis
      • Price range
      • Application
      • Sales and Market share analysis
      • Competitive Analysis
      • After Sales Analysis
      • Customer profile
      • Buyers pattern
    • Rigid Haulage
      • Product portfolio
      • Key Models
      • Technical Analysis
      • Price range
      • Application
      • Sales and Market share analysis
      • Competitive Analysis
      • After Sales Analysis
      • Customer profile
      • Buyers pattern
    • Tractor – Long Haulage
      • Product portfolio
      • Key Models
      • Technical Analysis
      • Price range
      • Application
      • Sales and Market share analysis
      • Competitive Analysis
      • After Sales Analysis
      • Customer profile
      • Buyers pattern
    • Special or Customized Application
      • Product portfolio
      • Key Models
      • Technical Analysis
      • Price range
      • Application
      • Sales and Market share analysis
      • Competitive Analysis
      • After Sales Analysis
      • Customer profile
      • Buyers pattern
  • Customer Behaviour analysis
    • Psychology trend
    • Behavior parameter outlook
    • Product Trend Analysis
    • Customer Segment analysis
    • Commercial Vehicle buying factors
    • Customer Loyalty
  • CV Product Segment Analysis:
    • Low Budget Segment
      • Description of segment
      • Price range
      • Key Models analysis
      • Application & product analysis
      • Customer segment and key buying motivates
      • Segment Trend – Historical and Future
      • Segment dynamics analysis
    • Medium Budget
      • Description of segment
      • Price range
      • Key Models analysis
      • Application & product analysis
      • Customer segment and key buying motivates
      • Segment Trend – Historical and Future
      • Segment dynamics analysis
    • High Budget
      • Description of segment
      • Price range
      • Key Models analysis
      • Application & product analysis
      • Customer segment and key buying motivates
      • Segment Trend – Historical and Future
      • Segment dynamics analysis
    • Premium
      • Description of segment
      • Price range
      • Key Models analysis
      • Application & product analysis
      • Customer segment and key buying motivates
      • Segment Trend – Historical and Future
      • Segment dynamics analysis
  • Zone wise Commercial Vehicle Market Analysis
    • North Zone
      • Market size
      • Market Trend
      • Market forecast
      • Market dynamics
      • Market share
      • OEMs wise analysis
      • Major Application
      • Demand Analysis
      • Market Drivers
      • The Major States for Commercial Vehicle sales
      • Zone wise Customer behavior
    • South Zone
      • Market size
      • Market Trend
      • Market forecast
      • Market dynamics
      • Market share
      • OEMs wise analysis
      • Major Application
      • Demand Analysis
      • Market Drivers
      • The Major States for Commercial Vehicle sales
      • Zone wise Customer behavior
    • West Zone
      • Market size
      • Market Trend
      • Market forecast
      • Market dynamics
      • Market share
      • OEMs wise analysis
      • Major Application
      • Demand Analysis
      • Market Drivers
      • The Major States for Commercial Vehicle sales
      • Zone wise Customer behavior
    • East Zone
      • Market size
      • Market Trend
      • Market forecast
      • Market dynamics
      • Market share
      • OEMs wise analysis
      • Major Application
      • Demand Analysis
      • Market Drivers
      • The Major States for Commercial Vehicle sales
      • Zone wise Customer behavior
  • State wise Analysis
    • Karnataka
      • Market size
      • Market Forecast
      • Market Dynamics
      • State Macro Economy
      • Market Trend
      • Commercial Vehicle Application analysis
      • OEMs wise plotting against market dynamics
      • Sales Strategy
      • Top Players
      • Upcoming New Projects
      • Product and Segment category demand analysis
      • Network Analysis
      • State GDP
      • Key Industries
    • Andhra Pradesh
      • Market size
      • Market Forecast
      • Market Dynamics
      • State Macro Economy
      • Market Trend
      • Commercial Vehicle Application analysis
      • OEMs wise plotting against market dynamics
      • Sales Strategy
      • Top Players
      • Upcoming New Projects
      • Product and Segment category demand analysis
      • Network Analysis
      • State GDP
      • Key Industries
    • Tamilnadu
      • Market size
      • Market Forecast
      • Market Dynamics
      • State Macro Economy
      • Market Trend
      • Commercial Vehicle Application analysis
      • OEMs wise plotting against market dynamics
      • Sales Strategy
      • Top Players
      • Upcoming New Projects
      • Product and Segment category demand analysis
      • Network Analysis
      • State GDP
      • Key Industries
    • Kerela
      • Market size
      • Market Forecast
      • Market Dynamics
      • State Macro Economy
      • Market Trend
      • Commercial Vehicle Application analysis
      • OEMs wise plotting against market dynamics
      • Sales Strategy
      • Top Players
      • Upcoming New Projects
      • Product and Segment category demand analysis
      • Network Analysis
      • State GDP
      • Key Industries
    • Jharkhand
      • Market size
      • Market Forecast
      • Market Dynamics
      • State Macro Economy
      • Market Trend
      • Commercial Vehicle Application analysis
      • OEMs wise plotting against market dynamics
      • Sales Strategy
      • Top Players
      • Upcoming New Projects
      • Product and Segment category demand analysis
      • Network Analysis
      • State GDP
      • Key Industries
    • Madhya Pradesh
      • Market size
      • Market Forecast
      • Market Dynamics
      • State Macro Economy
      • Market Trend
      • Commercial Vehicle Application analysis
      • OEMs wise plotting against market dynamics
      • Sales Strategy
      • Top Players
      • Upcoming New Projects
      • Product and Segment category demand analysis
      • Network Analysis
      • State GDP
      • Key Industries
    • Uttar Pradesh
      • Market size
      • Market Forecast
      • Market Dynamics
      • State Macro Economy
      • Market Trend
      • Commercial Vehicle Application analysis
      • OEMs wise plotting against market dynamics
      • Sales Strategy
      • Top Players
      • Upcoming New Projects
      • Product and Segment category demand analysis
      • Network Analysis
      • State GDP
      • Key Industries
    • Himachal Pradesh
      • Market size
      • Market Forecast
      • Market Dynamics
      • State Macro Economy
      • Market Trend
      • Commercial Vehicle Application analysis
      • OEMs wise plotting against market dynamics
      • Sales Strategy
      • Top Players
      • Upcoming New Projects
      • Product and Segment category demand analysis
      • Network Analysis
      • State GDP
      • Key Industries
    • Delhi/NCR
      • Market size
      • Market Forecast
      • Market Dynamics
      • State Macro Economy
      • Market Trend
      • Commercial Vehicle Application analysis
      • OEMs wise plotting against market dynamics
      • Sales Strategy
      • Top Players
      • Upcoming New Projects
      • Product and Segment category demand analysis
      • Network Analysis
      • State GDP
      • Key Industries
    • Chhattisgarh
      • Market size
      • Market Forecast
      • Market Dynamics
      • State Macro Economy
      • Market Trend
      • Commercial Vehicle Application analysis
      • OEMs wise plotting against market dynamics
      • Sales Strategy
      • Top Players
      • Upcoming New Projects
      • Product and Segment category demand analysis
      • Network Analysis
      • State GDP
      • Key Industries
    • Rajasthan
      • Market size
      • Market Forecast
      • Market Dynamics
      • State Macro Economy
      • Market Trend
      • Commercial Vehicle Application analysis
      • OEMs wise plotting against market dynamics
      • Sales Strategy
      • Top Players
      • Upcoming New Projects
      • Product and Segment category demand analysis
      • Network Analysis
      • State GDP
      • Key Industries
    • Uttaranchal Pradesh
      • Market size
      • Market Forecast
      • Market Dynamics
      • State Macro Economy
      • Market Trend
      • Commercial Vehicle Application analysis
      • OEMs wise plotting against market dynamics
      • Sales Strategy
      • Top Players
      • Upcoming New Projects
      • Product and Segment category demand analysis
      • Network Analysis
      • State GDP
      • Key Industries
    • Jammu & Kashmir
      • Market size
      • Market Forecast
      • Market Dynamics
      • State Macro Economy
      • Market Trend
      • Commercial Vehicle Application analysis
      • OEMs wise plotting against market dynamics
      • Sales Strategy
      • Top Players
      • Upcoming New Projects
      • Product and Segment category demand analysis
      • Network Analysis
      • State GDP
      • Key Industries
    • Gujarat
      • Market size
      • Market Forecast
      • Market Dynamics
      • State Macro Economy
      • Market Trend
      • Commercial Vehicle Application analysis
      • OEMs wise plotting against market dynamics
      • Sales Strategy
      • Top Players
      • Upcoming New Projects
      • Product and Segment category demand analysis
      • Network Analysis
      • State GDP
      • Key Industries
    • Maharashtra
      • Market size
      • Market Forecast
      • Market Dynamics
      • State Macro Economy
      • Market Trend
      • Commercial Vehicle Application analysis
      • OEMs wise plotting against market dynamics
      • Sales Strategy
      • Top Players
      • Upcoming New Projects
      • Product and Segment category demand analysis
      • Network Analysis
      • State GDP
      • Key Industries
    • Orissa
      • Market size
      • Market Forecast
      • Market Dynamics
      • State Macro Economy
      • Market Trend
      • Commercial Vehicle Application analysis
      • OEMs wise plotting against market dynamics
      • Sales Strategy
      • Top Players
      • Upcoming New Projects
      • Product and Segment category demand analysis
      • Network Analysis
      • State GDP
      • Key Industries
    • Bihar
      • Market size
      • Market Forecast
      • Market Dynamics
      • State Macro Economy
      • Market Trend
      • Commercial Vehicle Application analysis
      • OEMs wise plotting against market dynamics
      • Sales Strategy
      • Top Players
      • Upcoming New Projects
      • Product and Segment category demand analysis
      • Network Analysis
      • State GDP
      • Key Industries
    • West Bengal
      • Market size
      • Market Forecast
      • Market Dynamics
      • State Macro Economy
      • Market Trend
      • Commercial Vehicle Application analysis
      • OEMs wise plotting against market dynamics
      • Sales Strategy
      • Top Players
      • Upcoming New Projects
      • Product and Segment category demand analysis
      • Network Analysis
      • State GDP
      • Key Industries
  • Pricing Trend Analysis: MRP & Discount Trend
    • Small Commercial Vehicle
    • Light Duty Commercial Vehicle
    • Medium Duty Commercial Vehicle
    • Heavy Duty Commercial Vehicle
    • Competitive price position of Tata, Ashok Leyland, BharatBenz, AMW, MAN, Piaggio, Force Motors, Mahindra, Volvo, Scania, SML Isuzu, Isuzu, Eicher
  • Business Environment
    • Major challenges
    • Opportunities
    • Global Impact
    • Business Sentiments
    • Political & Economy
    • FDI and Exchange rate
  • Major Export Market
    • OEM Analysis
    • Key Export markets
  • Application Industry Analysis
    • Construction
    • Road
    • Real Estate Development
    • Port
    • Mining
    • Logistics
    • E Commerce Industry and its impact on Commercial Vehicle Industry
    • Cement Industry
    • ODC
    • Light & heavy Machinery
    • Manufacturing Industry
    • Local Transport
  • Used Commercial Vehicle Analysis
    • Market size
    • Commercial and Technical challenges
    • Buying pattern
    • Trend Analysis
    • Business practice
    • Advantages
    • Disadvantages
    • Finance challenges
  • Advertising
    • Commercial Vehicle Industry traditional way
    • Most effective ad strategy
    • Competitor Ad strategy
    • Print
    • Electronic
    • TV Commercial
    • Digital
  • Company Analysis
    • Tata Motors
      • Latest Developments
      • Product portfolio
      • Product age
      • Product life cycle
      • Application analysis
      • Strategy
      • Segment Analysis
      • Customer profile
      • Brand perception
      • USP
      • Key persons
    • Ashok Leyland
      • Latest Developments
      • Product portfolio
      • Product age
      • Product life cycle
      • Application analysis
      • Strategy
      • Segment Analysis
      • Customer profile
      • Brand perception
      • USP
      • Key persons
    • Eicher Motor
      • Latest Developments
      • Product portfolio
      • Product age
      • Product life cycle
      • Application analysis
      • Strategy
      • Segment Analysis
      • Customer profile
      • Brand perception
      • USP
      • Key persons
    • Volvo
      • Latest Developments
      • Product portfolio
      • Product age
      • Product life cycle
      • Application analysis
      • Strategy
      • Segment Analysis
      • Customer profile
      • Brand perception
      • USP
      • Key persons
    • Scania
      • Latest Developments
      • Product portfolio
      • Product age
      • Product life cycle
      • Application analysis
      • Strategy
      • Segment Analysis
      • Customer profile
      • Brand perception
      • USP
      • Key persons
    • Force Motors
      • Latest Developments
      • Product portfolio
      • Product age
      • Product life cycle
      • Application analysis
      • Strategy
      • Segment Analysis
      • Customer profile
      • Brand perception
      • USP
      • Key persons
    • Piaggio
      • Latest Developments
      • Product portfolio
      • Product age
      • Product life cycle
      • Application analysis
      • Strategy
      • Segment Analysis
      • Customer profile
      • Brand perception
      • USP
      • Key persons
    • Mahindra
      • Latest Developments
      • Product portfolio
      • Product age
      • Product life cycle
      • Application analysis
      • Strategy
      • Segment Analysis
      • Customer profile
      • Brand perception
      • USP
      • Key persons
    • Daimler India Commercial Vehicle (DICV)
      • Latest Developments
      • Product portfolio
      • Product age
      • Product life cycle
      • Application analysis
      • Strategy
      • Segment Analysis
      • Customer profile
      • Brand perception
      • USP
      • Key persons
    • Isuzu Motors
      • Latest Developments
      • Product portfolio
      • Product age
      • Product life cycle
      • Application analysis
      • Strategy
      • Segment Analysis
      • Customer profile
      • Brand perception
      • USP
      • Key persons
    • SML Isuzu
      • Latest Developments
      • Product portfolio
      • Product age
      • Product life cycle
      • Application analysis
      • Strategy
      • Segment Analysis
      • Customer profile
      • Brand perception
      • USP
      • Key persons

The can be customize as per the requirement. Every time, updated version of the report is available along with Excel and Power Point version.