The electric and hybrid Vehicle feasibility report is exclusive assistance which will help the clients to evaluate the market size, growth opportunity in the market, opportunities, risk, and expected problems in the electric vehicle business. ACG Strategy Consulting service is available for new players including foreign companies and existing players to create the base to launch their products in the market and to become successful.

The study will cover requirements, investment, ROI, product portfolio, product value proposition, product life cycle, risk assessment, and business cases. Two Wheeler Electric Vehicle, Three Wheeler Electric Vehicle, Electric bus, Electric Truck, and others.

Before taking the decision on “Go to Market”, ACG will prepare a detailed blueprint of the entire Electric vehicle Ecosystem. It will help the companies to prevent the losses and increase profit by identifying the key areas of the business as well as the proper requirements to be successful in the market. The analysis is based on either on the company’s strength or market demand and dynamics or by mapping the company’s strength to market dynamics.

Indian market is one of the largest growing automotive markets in the world. Government is encouraging to perforate electric vehicle by introducing FAME II, NEMMP, and other valuable schemes.

Indian market will have to set up the complete supply chain system in order to bring down the vehicle price. Currently, about 90 percent of parts are imported from other parts of the world. This import can reduce the profit margin as well as not help in developing the technology and the market.

Government schemes aimed at incentivizing the use of E- vehicles across all vehicle segments ranging from the two-wheeler segments to light commercial vehicles and bus sector. The electric vehicle segment development will have to meet the following requirements:

  • Development of technology
  • Create demand
  • Setup charging infrastructures

It is very crucial to make a detailed study of electric vehicle project feasibility. ACG will assist the companies to provide business solution for market assessment, competitive study, Projected Investment plan, the return of Investment, risk factors and business Cases.

ACG is the total answer for all the business queries for a successful business venture for the companies and brands located in India as well as abroad.

Key Highlights of the report:  Manufacturer and Auto Components

  • Feasibility on economy scale | Project cost | Financial Analysis
  • Operational level Feasibility analysis
  • Study on Market Feasibility
  • Technical Feasibility report
  • Production and Assembly line
  • MAN power requirement
  • Social impact
  • Strategic plant location
  • Land acquisition
  • Charging station Project cost and its feasibility
  • Central & State Policies
  • Country Analysis
  • Economy Assessment
  • Industry Analysis
  • Market Assessment
  • Electric vehicle Demand Analysis – Volume forecast
  • Product offering, Product Analysis, and Product Pricing
  • Product life cycle
  • Marketing Plan & Strategy | Budget
  • EV After Sales Support
  • Channel Sales
  • Dealer network Strategy

We have released the Global Electric Vehicle Report and Outlook 2040. This is a detailed report on every segment of Electric Vehicle. The report contains Car, Two Wheeler, and Electric Bus, ACG expected that Electric auto sales will cross 10 percent of total auto sales from the current level of around 2 percent.

Highlights of the report:

  • The market size (Volume & value) of the Global EV
  • Market share of total Industry volume
  • Top 10 EV markets and future top market forecast
  • OEM wise country-wise presence
  • OEM planning and EV strategy Analysis
  • Segment-wise trend and forecast
  • New and upcoming Product launches
  • Product positioning Global Electric Vehicle Report and Outlook
  • Product pricing
  • Product specs
  • Product platform
  • Customer segment
  • Charging Infrastructure
  • Country-wise Govt policies
  • Major players in each segment
  • Challenges and Opportunities
  • Battery Analysis – Technology, Major manufacturers ad Pricing
  • Brand Position, Marketing Strategy
  • Sales Strategy and its expected impact
  • Customer awareness
  • Customer acceptability analysis
  • Business case
  • Feasibility report
  • Case Study: TESLA

Electric Two Wheeler Market Forecast and Analysis. We have released the latest report on the Electric vehicle which is detail report on this segment.

Highlights of the Electric Two Wheeler Report:

  • Overview of the Global and Indian Two Wheeler Industry
  • Current Market Scenario
  • Customer buying behaviour for Electric Two Wheeler
  • Segment wise Sales Forecast, Market share and Expected growth in next 10 years
  • Product Concept & Design – Scooter & Bike | Prototype
  • Business case
  • Plan and Strategy Execution
  • Market Survey
  • Vehicle Operating economy
  • Product Position
  • Pricing Strategy and its trend
  • Brand Awareness
  • Competitor Analysis
  • SWOT Analysis
  • New players planning to enter into Indian Electric Two Wheeler Market
  • Key Challenges and Expected solution
  • It impacts on Environment
  • Target Segment and Product USP
  • Product Launch Strategy

Report for Two Wheeler Greenfield Project:

  • Greenfield Strategy
  • How to set up Production plant in India
  • IT Infrastructure
  • Government/Authorities requirement
  • How to choose Strategy location for production plant
  • Cost Analysis
  • ROI Analysis
  • Risk Analysis
  • Contingency plan
  • Human Resource Planning and strategy
  • Export plan

The report is available for Premium Subscriber also, If you are not the premium subscriber please contact to nidhi.singh@autobei.com

Customize Report  Option is also available

The future trend of the Indian Commercial Vehicle market is the most detailed report. The current Indian Commercial Vehicle market size is over 1 million units and in terms of value, it is USD 14 billion in FY 2019. Tata and Ashok Leyland are the current market leaders in the commercial vehicle segment.

The commercial vehicle segment has registered an 8 percent CAGR between the years of 2012 and the year 2015. The commercial vehicle segment was able to register a growth rate of 8 to 12 per cent between the years 2012 to 2015.

Between the years 2013 to 2015, the CAGR for the SCV segment was -8 per cent. In the following years, the CAGR jumped to 18 per cent between the years 2015 to 2019. In the HCV segment, the CAGR came down to 7 per cent from 30 per cent between the years 2015 to 2019.

Indian CV Industry Growth by segment and Outlook 2024

In the SCV segment, Ashok Leyland and Maruti Suzuki gained a better market share. The major players like Tata Motors, Mahindra, Force, and Piaggio lost their market share for the year 2019 when compared to the year 2015.

In the LCV segment, Ashok Leyland, Mahindra, and Eicher gained a better market share. In the MCV segment, Ashok Leyland is the only OEM that gained a 7 per cent market share due to its product portfolio and service options. In the HCV segment, Ashok Leyland and Mahindra increased their market share by 5 and 2 per cent respectively in the year 2019.

Indian CV OEMs Market Share 2019

The industry has started to face new challenges and hurdles with the innovation of new technology, emission norms, market sentiments between the customers, Cost pressure on the customers, expected rise in oil prices, and tight financing. Infrastructure development and border-free movements are positive changes in the industry.

Indian Truck Industry Trend and Forecast:

Indian Truck Industry registered a 25 per cent growth in FY 2019 compared to FY 2018. The industry is facing new trends due to changing market dynamics. The tractor-trailer market and heavy-duty segment also started to move in a different direction. The tractor Trailer segment noted a 15 per cent degrowth due to heavy-duty customers moving to the Rigid Truck segment. Tata, Ashok Leyland, and Eicher are the market leaders in some segments.

Indian Truck Industry Market Trend and Outlook

The main market can be defined as the Low, Value Plus, and the premium truck segment.

Value plus Low cost and Premium Truck segment

In this report, we will cover and analyze the details of the commercial vehicle market and the needs and requirements for customer satisfaction.

Commercial Vehicle Industry Landscape:

The fleet owners or transporters are the key stakeholders of the commercial vehicle industry. There are five main components for the fleet owners which will include vehicle, financing, product support, vehicle Body and other value-added services provided by the companies. By selecting the best combination of the CV package they try and invent methods to increase their profit level and make maximum utilization of their fleet capacity. A good profit level can be attained precisely through the (best suitable for application) vehicle purchase price, choosing the most appropriate truck which will suit the required application.

The CV customers are mainly divided based on the vehicle application, type of vehicles, and fleet size. Based on the fleet size this segment can be further divided into a single fleet owner, small fleet owner, medium fleet owner, large fleet owner and corporate or very large fleet owner. The key challenges for the transporters are improving their profit level, shortage of drivers, Loading and Unloading mechanism, after-sales, and better fleet Utilization.

Currently, freight transport in India is mainly dominated by road transport. Transportation through road medium accounts for 59 per cent of freight movement. 35 per cent of freight demand is met by rail transport, 5 per cent of freight movement is maintained through waterways and less than 1 per cent of freight transport is by air transport.

Transportation Structure in India

Fleet Owner Business Model (Small, Medium, and Large)

Small and Medium Fleet owner business model:

Small and medium fleet owners face many critical issues. Their profit is also less when compared to other segments. The small and medium fleets most of the revenue is used to cover the operating cost of the vehicle like paying EMI, driver salary, tax, maintenance cost, brokerage fees, and tyre replacement cost which is one of the major issues which comes under the maintenance section. The profit during the time of paying EMI is very small. For long Haul, fuel cost is around 60%. Once the loan amount is fully paid, they start to make some profit. Another way to make money is by selling the vehicle at market value after a certain period of usage.

Small, Medium and Large Fleet owner business Model

The Small and Medium fleet owners are struggling to make a good profit because there is strong pressure on the trucking firms to provide low-cost service. To win business in those hyper-competitive markets, truck operators commonly resort to illegal tactics such as overloading and driving more hours per day than permitted under hours of service regulations. The scenario is worst in the case of the tipper which is used for coal transport purposes.

Transporters Profitability Analysis

Axle load norms Impact:

After the amendment of axle load norms, Transporters are making more profit after considering the extra burden of Mileage and other impacts on vehicles like maintenance and Tyre life. Clients of Transporters Started to demand to lower the freight rates since the permissible payload increased. On the other hand, Fleet owners started to demand to Increase in freight rates. They are considering the extra maintenance cost, Tyre cost, fuel consumption, etc.

Maximize the profit:

Trucking costs are the key factors in the transportation component of total logistics cost accounting which will account for more than 65 percent of that cost. To reduce these costs a three-pronged strategy can be adopted:

  1. Maximum Utilization of Truck capacity
  2. Increasing fuel economy of trucks
  3. Lowering the total fixed costs

Medium-size Transporters can increase their profit margin by properly tracking the vehicle, improving product portfolio, and strictly controlling operating costs.

For example, in the Cement and Ash transportation sector, the average used truck (Considered the most suitable model) price after 5 years is around 30 to 35 per cent lower than the actual vehicle price. This 30 to 35 per cent will be the transporter’s profit after 5 years of usage.

For large Transporters, their profit is better than Small and medium fleet owners. Large fleet owners are having better profit because they have their own workshop, spare parts inventory, direct contact with consigner and they will have their diesel pump. This will make significant efforts in cost reduction. Own workshop could save 20 to 30 percent cost.

Fleet Owner Business Profile:

Fleet Owner Business Profile

Demand Forecast:

We have noticed major changes in the market dynamics in the last 6 months. ACG does the market forecast every quarter. Some of the Application wise Truck Market Forecast are listed below:

Application wise Truck Demand Forecast Analysis

Customer complete Purchase journey:

We have spent an enormous amount of time understanding customer behaviour, reactions, preferred choice, Brand Relevance, Product selection, after-sales issues and so on. We do not do surveys but our expert’s discussion with them on the most critical issues and other business dynamics helps them understand the flaws in the system.

We found many customers who recommended the brand and product to other customers in his circle. We have identified the reasons for the recommendation.

In our initial journey, brand relevance is an important factor in converting the name of the brand into sales. We have done an exclusive study on brand relevance.

We have also researched the Indian truck market characteristics based on performance, distance, and applications in detail.

Fleet Owner journey- From Product to Service


Fleet owner Truck buying steps

Truck Driver Issues:

The availability of drivers is another challenge for Transporters. There are two sides to the Truck driver’s issues. One of the major factors is a social and economic factor which is present not only in India but also in a developed country like Germany. Health is also another challenge for drivers depending on the driving time and resting period. Fleet owners considered a small amount like 1,000 Rs for reimbursement during on-duty health issues.

Employment in the Indian logistics industry, particularly as a truck driver, is a hard life. Truck drivers typically spend long periods away from home and family; more than 25 per cent of drivers return to their home base only after 10 days. This time gap will reduce the quality of life and this will lead to poor outcomes in both physical and psychological health. Around 50 per cent of the truck drivers face driving-related health issues. In the year 2018, approximately 70 per cent of truck drivers did not have any medical check-ups. Truck drivers are also poorly paid, earning only half as much as cab drivers. Furthermore, poor logistics practices often lead to unsafe practices such as overloading of trucks, which will make them compromise road safety both for truck drivers and those with whom they share the road.

This combination of factors— low pay (7,000 to 10,000 INR monthly), high risk and low quality of life is driving a decline in the number of truck drivers. From 900 truck drivers per 1,000 trucks in 2001, the number fell to 550 truck drivers per 1,000 trucks in 2018.

Some companies are taking the initiative and trying to support truck drivers. One of the companies started to provide hygienic food at 90 Rs to Truck drivers on the highway and the facility to park their vehicles at night.

Another non-profit organization IIFM started to train the drivers, provide Social security benefits, give them an identity, Professional benefits and so on.

Truck Driver Issues and ACG Driver survey

Some people take advantage of this shortage of drivers to arrange for a CV driving license illegally to become a truck driver. The transporter firm does not check the authenticity of the license and also it is a difficult task to know about drivers. It is also noted that many times criminal people also follow the same practice to attain the license.  Happened many times that these illegal truck drivers sold the transporter’s material which they drove and ran away with the amount.

Another challenge is when a driver wants to become a fleet owner; it is a difficult task to get finance. If they become the fleet owner, they need finance to manage operating costs. Most of the companies are offering services to fleet owners but not drivers. Automotive suppliers, OEMs, and Financial institutes should take CSR initiatives for drivers to manage operating cost. Many firms hesitate to do that since it will impact their profit range.

Brands should leverage such social issues to make the market better for their better future. It is easy to connect with potential buyers or users emotionally to sell the product rather than taking in celebrities to advertise the product to enhance the sale rate. ADAS also can play an important role not only for drivers but for the entire CV Industry.

ADAS in Truck Vehicle

Vehicle Efficiency:

There is an urgent need to introduce the Pallet system; this standard system increases the incredible efficiency of loading and unloading time. This system can reduce 70 percent time and this would be 25 percent more cost-effective.

The semi-trailer segment also helps to increase efficiency because the large and fully loaded truck transport carries more freight per kilometre driven. High loading efficiency can be achieved in two ways, first by moving towards the larger trucks segment and second by collecting small loads into large ones to fill those trucks.

Articulated Tractor Trailer segment need to be introduced in India

This helps to prevent wastage of time and money. Logistics efficiency can also benefit farmers through a reduction in loss and wastage of products during transportation to markets. Brazil widely used Semi-Trailer for the transportation of Agricultural products.

The fully loaded trucks are dispatched in time by technologically and operationally sophisticated logistics. The logistics are the optimal state of affairs. Medium & Heavy trucks require sufficient infrastructure to enable their effective operation.

The cost of the freight movement by road is 2.61Rs/ton for one km as compared to 1.43 Rs/ton per km for rail and INR 1.09/ton per km for waterway transport. The transportation by Truck provides a lot of flexibility to transporters and the consignee.

The revised and improved measures will improve logistics and improve the overall performance of all sectors.

Efficient logistics is a cornerstone of the continuation of India’s economic development over the coming decades.

By reducing the transportation cost by 5 per cent in India, the demand will increase between 6 to 12 per cent depending on the type of products and other product characteristics. The truck logistics cost is one of the major cost factors in the entire supply chain it has to be maintained efficiently for a better profit margin.

India loses 20 to 30 per cent of agricultural production profit due to wastage in the supply chain. Reducing that wastage could both provide a boost in the income to the farmers and also lower overall prices to produce and create better access to high-quality food for Indian citizens.

After-sales or Product support is always a very critical issue for Transporters since it is business for them. We have identified various parameters which will impact the clients on their first time and repeated purchase of products.

Many Tech companies are trying to penetrate commercial vehicle by introducing many latest technology solutions. Until and unless the companies do not understand the ecosystem, it is difficult to be successful in the market. The truck industry is dominated by small and medium-sized transporters and the profit of this segment is less. The truck industry does not have enough budgets for digitization and technology development. Another reason for the reduced success rate is the declined literacy rate of the drivers, and fleet owners, and the third reason is conventional business practice.

Truck Fleet Management Software Solution

ACG developed Exclusive software for Fleet Management companies which would help all stakeholders of the Industry. It improves Transporter’s efficiency immediately after implementation. It is suitable for medium and large fleet owners.

ACG Fleet Management Software

ACG Fleet Management Software_Trip Summary


Key Aspects of Post Sales:

Truck After Sales Analysis

To keep the post-sales cost on the lower side the manufacturers necessarily need to implement some of the effective strategies of maintenance like maintenance based on time, condition and predictive maintenance with the use of remote monitoring for the improvement of the product uptime. The companies can significantly reduce the ownership cost by lowering the costly repairs, enhancing the lifecycle of the products and an improvement in the performance of the product.

In the first part, we analyzed the Long Haul vehicle and in After Sales, we are talking Tipper as an example. The tipper customers have to necessarily total ownership cost over the vehicle’s life cycle. The cost of operation of the vehicle like the wages of drivers, fuel and other tax and toll charges contribute to the total ownership cost. This is estimated to be about two-thirds of the total cost. The balance of accounts post-sales is ten percent and nine per cent depreciation of the vehicle. The post-sale cost of ten per cent is further divided into eight per cent for repair & maintenance and two per cent for oil, tyres and vehicle cleaning. The mentioned percentages might differ as per the pattern of usage. For example, we can consider the ones whose usage of the vehicle is less intense, the post-sale cost will be around ten per cent. But on the other hand, the cost might be around twelve per cent if the vehicle is used in conditions that are quite challenging. The post-sale cost can further be divided into labour and parts. Only labour averages to about forty per cent of the total post if the service, as well as the maintenance, is done at OEM garages. The remaining sixty percent is for the spare but those are consumed directly at the time of maintenance and repair.

Repair and maintenance are two different activities that are being performed at the service centres of the OEMs. The maintenance of the vehicles includes inspection along with the wear and tear. The inspection so carried out are recurring jobs that have to be necessarily carried out at regular intervals of time depending on the kilometres run by the vehicle. Wear and tear refer to the small damages occurring normally as the ageing process of the vehicle. Wearing out of the tyres or the replacement of the oil filters or the air filters are examples of wear and tear. This is a gradual process and hence possible to go for scheduled maintenance as per the requirements. For general maintenance, downtime cannot be avoided. Therefore, the ultimate objective of the Tipper customers should be to keep the related costs on the lower side as much as possible.

Process of Breakdown:

Repair and diagnosis as a result of any breakdown or an accident happen unexpectedly and this is the reason why it is so important to minimize the downtime. This is even more important because a huge number of manufacturing companies necessarily deliver the items to the customers just in time. The delays in shipping seriously impact the parts supply of the downstream supply chain activities. The manufacturers in this regard provide 24*7 backup as an emergency but they should also provide the first time appropriate diagnosis by keeping handy skilled and trained manpower along with the possession of the required diagnostic tools. Once the diagnosis has been made at the time of attending the breakdown process, the less complicated breakdowns should be dealt with instantaneously on the spot and in the more complicated cases the vehicle should be towed to the nearest authorized service centres where the repairing should be either immediate or within 24 hours depending on the hours of business, the severity of the breakdown and at what time it has occurred.

Requirements Of Customers

For the minimization of the total ownership cost, low-priced services are essential and the same goes for the spare parts as well. However, the needs of the customer regarding uptime as well as the total cost of ownership do not have the same importance across all the segments of customers. For the owner-operators, the requirement for high service availability is of immense importance if the vehicle happens to be a vital tool for the conduction of business.  The requirement for high-quality post-sales for the owner-operators is just as important as compared to the other CV customers. Despite the strong need for lowering the total ownership cost, there are only a few options available for the reduction of these costs.

The operators of large fleets usually pay the most attention to service availability as well as quality. They get on terms with the manufacturers for some of the special deals at the time of purchasing the vehicle, where they ask the manufacturers for fixed costs based on per ton-kilometre and service levels. The operators of large fleets and municipalities generally have a very critical fleet size for the determination of whether setting up a proprietary service workshop would be an economically better option or offering additional cost reduction potential would be better.

Different Types of Service Providers:

  • Customer workshop available in the house
  • Private parties owned workshops
  • OEM’s authorized garages
  • Workshops of OEM.

In general, the customer workshops available in-house are equipped for providing only very simple services like the treatment of wear and tear, minor inspections and very simple repairs. The private garages usually deal with almost all types of OEM vehicles and are necessarily in possession of all sorts of sophisticated tools as well as equipment and can offer even breakdown services to the customers. The Garages that are authorized by OEMs generally have all the types of required tools and equipment. The manpower of OEMs is adequately trained and vastly experienced to provide all sorts of services that then customers require. But still, there are several customers who prefer only the OEM workshops where services are quick and prompt along with the availability of a required set of tools as well as equipment and also with backup spare parts. Thus, almost all sorts of service and maintenance-related decisions are taken rapidly which in turn plays a vital role in the reduction of downtime to a great extent.

To sum the whole thing up, the post-sales costs are certainly one of the most critical elements which get the attention of the Tipper customers. Thus, at this point, they should be following

the two objectives of uptime maximization of the vehicle and total cost of ownership minimization post-sales. By doing the same, depending on the customer segment, the Tipper customers can necessarily select between the authorized, independent, and in-house customer workshops, which are varying in their scope as well as the capabilities of the service. Moreover, a few of the cases mentioned above can be certainly taken care of necessarily at the spot of breakdown itself. In many cases, the vehicle might require to be towed to the authorized service centers that are nearby.

Development of the OEM Owned And Authorised Service Outlets:

The service outlets owned by the OEM are on the rise and this rise is very likely to go on for two main reasons.

  • Firstly, the OEMs many times find it very difficult to find the appropriate independent investors in the areas that are less populated initially.
  • Secondly, some OEMs have intentionally chosen to follow a network strategy that is owned by the OEM to be much more responsive to the market conditions that are volatile.

During the warranty period, almost all of the fleet owners necessarily make use of OEM service outlets, and post-warranty period, the owners who have a fleet strength of about 80 to 100 vehicles prefer to have their setup for service. But on the other hand, the small fleet owners maintain a tie-up with local service centres for all types of minor routine work and when they face some major problems, they take help from the OEM service centres.

For the fleet owners who have achieved a certain fleet size, for them, it might be a good option to set up their in-house service workshop. Now, when they have their workshop, the fleets necessarily have much greater flexibility at the time of scheduled maintenance and often they can achieve lower costs owing to the fact of the lower expenses for marketing and overheads. However, it is to be kept in mind that the capabilities of these in-house workshops are generally limited, since the main focus is only on the simple maintenance services. But in case the more complex maintenance services and repair, the work is to be necessarily forwarded to external service centers.

Distribution of Spare Parts:

The spare parts distribution network is much more complex as compared to the service network for the four main reasons that are listed below.

  • In the case of the service network, it is only the CV operators who are only indirect customers, whereas, for the network of spares, it is the OEM-owned or authorized service outlets, independent service providers, as well as the in-house workshops of the customers, are the direct customers.
  • Coming to the supply side, apart from the OEM, the OES and the parts of matching quality producers also exist. The OES not only sell the parts to the OEM but also, sell on the aftermarket at the same time.
  • The parts of the matching quality producers are usually from low-cost countries, like China, which provide similar copies of the OES parts at a very competitive price.
  • Finally coming to the side of distribution, both the OES and parts of matching quality producers have the scope of either selling directly to their customers or selling through independent parts wholesalers.

Share of The OEM Parts:

Despite the presence of matching parts manufacturers, the share of OEM parts is on the rise because in the OEM’s organization, the OEMs necessarily benefit from the fact that suppliers are also the consumers. The service outlets owned and authorized by the OEMs directly consume the spare parts which they need for providing the required service to CV customers. In particular, the service outlets that are not only owned by the OEMs but also are authorized by them necessarily have a very high degree of loyalty to the OEMs and the major portions of the spare parts are also received through the OEM’s organization. In addition to this, the OEMs get a lot of benefits from the coverage of the total value chain. About one-third of the total CV customers purchase the maintenance as well as the repair packages in addition to the vehicle itself. Now, in these cases, the OEM takes the risk of future maintenance as well as repair costs and thus the vehicles are serviced within the network OEMs along with receiving all of the required spare parts through the OEM’s organization.

To increase the reach of almost all of the CV manufacturers, it appoints an exclusive spare parts outlet or the distributor. These outlets or the distributors necessarily make sure that the spare parts are available at the retailer’s shop as well. The spare parts outlets owned by the OEM are expected to rise modestly, but given their low significance in the overall share of outlets, this rise will be quite marginal. In recent times, though the number of outlets has gone down, it is expected to grow again in line with the overall market thereby an increasing trend would be followed in the case of the parts outlets.

Source Of Spare Parts of Authorised Outlets:

Now, if we consider the supply of parts by respective service providers, the service outlets owned by the OEMs receive a hundred per cent of their spare parts through the OEM organization as they are an integral part of the same. However, on the other hand, the authorized service outlets do not have any kind of obligation to source their parts through the OEM. Instead, the service outlets that are authorized have the freedom of choosing where to source their supply of spare parts.

The spare parts outlets that are authorized can enjoy a lot of advantages at the time of sourcing the parts from the OEM. For example, we can consider the OEM’s organization. First of all, the OEM provides great support in the adequate stocking of the parts. As the authorized spare parts outlets maintain a wide range of spare parts in stock, they require to have detailed knowledge along with historical data for the determination of the optimal levels of stock for each of the parts individually. Secondly, the OEM covers the risk in a case when the levels of stock are not true. This happens either when the stock levels are too high which has led to a very high capital employed or in a case where the stock levels are too low which means that there is a requirement of an emergency shipment by the OEM. Thirdly, the authorized outlets take advantage of a high-performing, proven, trusted as well as a reliable network of logistics and IT systems. Fourth, the authorized outlets are one-stop shopping and a common part numbering system greatly reduces the complexity of communication and IT systems. Ultimately, the customized financial conditions also help in providing an incentive for sourcing the parts from the OEM, and this in turn finally results in the lowering of the costs of sourcing.

ACG developed exclusive software for the Automotive Industry:

ACG Digitization of Truck After Sales Support Software

Key Highlights of the report:

  • Indian CV and Truck Market size in Volume (Volume) & Value (in USD)
  • Application Short, Medium and long-term Demand Forecast
  • Impact of New norms on the Commercial Vehicle market like pricing, demand and after-sales support
  • State wise Market size, Key players, and Forecast
  • Pricing Strategy and discount trend
  • After Sales Service Analysis
  • Key Market Drivers and Dynamics
  • Key Model – Specs, Features, and Price
  • Application-wise Demand Analysis
  • OEMs-wise Product Strategy
  • Indian Transportation Industry
  • Fleet Owners Survey
  • Fleet Owner Business Model
  • Freight rate analysis
  • Fleet owner pattern trend
  • Key factors for Fleet owners
  • Market forecast
  • Technology Role Indian CV Industry
  • Customer Buying Journey
  • Competitor Analysis
  • Product Strategy, Portfolio, and Portfolio
  • Segment wise Application Product, Market share, and OEM wise Volume
  • Segment Analysis: Small commercial Vehicle, Light Commercial Vehicle, Medium Commercial Vehicle, and Heavy Commercial Vehicle
  • Sub-segment Analysis: Mini Truck, Pick up Truck, LDT, MDT, HDT, Tractor Trailer, Tipper and Special Application
  • Segment shift Trend and Forecast

Every Year ACG released most detail and critical Research Report on Indian Automobile Industry Report which covers all major vertical of Industry including Electric Vehicle and Govt policies to promote it. The report contains Historical Trend and next 5 years forecast. Indian is expected to be among the Globally top 3 markets by 2030 by touching USD 270 billion. We analyzed multiple factors which influenced the Automotive sector. This also helps the foreign and Indian companies which are planning to invest in the Automobile sector. The report is available on subscription-based also. The Monthly and Quarterly subscription option is available to get every pulse of the industry movement.

Each chapter gives qualitative analysis, Challenges, Opportunities, and Market Drivers also. Additional information like Doing business in India, Finding a partner in India, Consumer buying behavior, Product launching strategy, Marketing & Branding Strategy, Digital solution, Sales Planning, and Business etiquette in India.

Table of Content of the report:

1       Summary

2       Automobile Industry Overview

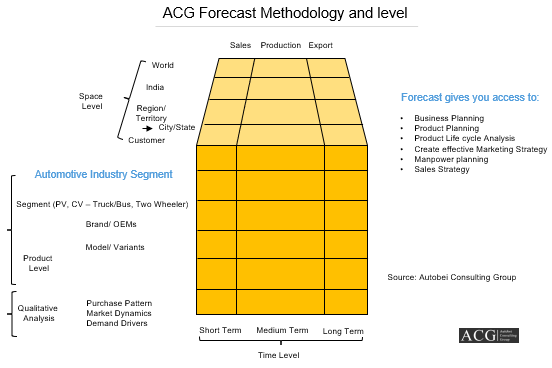
3       Methodology and Limitation of Study

4       Country Analysis – India

4.1.       Politics

4.2.       Economy

4.3.       Risk

4.4.       Regulation

4.5.       Business

4.6.       Industry

4.7.       Culture

5.      Auto Industry Statistics Analysis – Since 2013 to 2017

6.      Indian Automotive Industry Overview and Segment Analysis

7.      Passenger Vehicle

7.1.       Car

7.1.1.         Market Size (Unit & Value)

7.1.2.         Segment Share

7.1.3.         Growth

7.1.4.         Latest updates

7.1.5.         New Product Launched

7.2.       UV/SUV

7.2.1.         Market Size (Unit & Value)

7.2.2.         Segment Share

7.2.3.         Growth

7.2.4.         Latest updates

7.2.5.         New Product Launched

7.3.       Van

7.3.1.         Market Size (Unit & Value)

7.3.2.         Segment Share

7.3.3.         Growth

7.3.4.         Latest updates

7.3.5.         New Product Launched

8.      Commercial Vehicle

8.1.       Medium & Heavy Commercial Vehicle

8.1.1.         Market Size (Unit & Value)

8.1.2.         Segment Share

8.1.3.         Growth

8.1.4.         Latest updates

8.1.5.         New Product Launched

8.2.       Light Commercial vehicle

8.2.1.         Market Size (Unit & Value)

8.2.2.         Segment Share

8.2.3.         Growth

8.2.4.         Latest updates

8.2.5.         New Product Launched

9.      Two-Wheeler Analysis

9.1.       Market Size (Unit & Value)

9.2.       Segment Share

9.3.       Growth

9.4.       Latest updates

9.5.       New Product Launched

10.         Scooter (Unit & Value)

10.1.          Sales Volume

10.2.          Segment Share

10.3.          Growth

11.         Motorcycle (Unit & Value)

11.1.          Sales Volume

11.2.          Segment Share

11.3.          Growth

12.         Moped (Unit & Value)

12.1.          Sales Volume

12.2.          Segment Share

12.3.          Growth

13.         Three-Wheeler

13.1.          Market Size (Unit & Value)

13.2.          Segment Share

13.3.          Growth

14.         Three-Wheeler Passenger Vehicle

14.1.          Sales Trend Analysis

14.2.          Segment Share

14.3.          Growth Analysis

14.4.          Segment Share

15.         Three-Wheeler Cargo Vehicle

15.1.          Sales Trend Analysis

15.2.          Production Trend Analysis

15.3.          Export Trend Analysis

15.4.          Segment Share

16.         Passenger Vehicle Detail Analysis – Market Trend, Market Share and Growth

16.1.          Market Size (Unit & Value)

16.2.          Segment Share

16.3.          Growth

16.4.          Latest updates

16.5.          New Product Launched

16.6.          OEMs Sales, Market Share, and Growth Analysis

16.6.1.      FIAT

16.6.1.1.       Company Overview

16.6.1.2.       Sales Volume

16.6.1.3.       Market Share movement

16.6.1.4.       Product Portfolio and Analysis

16.6.1.5.       Production plant

16.6.2.      Force Motors

16.6.2.1.       Company Overview

16.6.2.2.       Sales Volume

16.6.2.3.       Market Share movement

16.6.2.4.       Product Portfolio and Analysis

16.6.2.5.       Production plant

16.6.3.      Ford India

16.6.3.1.       Company Overview

16.6.3.2.       Sales Volume

16.6.3.3.       Market Share movement

16.6.3.4.       Product Portfolio and Analysis

16.6.3.5.       Production plant

16.6.4.      Hindustan Motor Fin. Corp.Ltd/Hindustan Motors Ltd

16.6.4.1.       Company Overview

16.6.4.2.       Sales Volume

16.6.4.3.       Market Share movement

16.6.4.4.       Product Portfolio and Analysis

16.6.4.5.       Production plant

16.6.5.      Honda

16.6.5.1.       Company Overview

16.6.5.2.       Sales Volume

16.6.5.3.       Market Share movement

16.6.5.4.       Product Portfolio and Analysis

16.6.5.5.       Production plant

16.6.6.      Hyundai

16.6.6.1.       Company Overview

16.6.6.2.       Sales Volume

16.6.6.3.       Market Share movement

16.6.6.4.       Product Portfolio and Analysis

16.6.6.5.       Production plant

16.6.7.      Isuzu Motors

16.6.7.1.       Company Overview

16.6.7.2.       Sales Volume

16.6.7.3.       Market Share movement

16.6.7.4.       Product Portfolio and Analysis

16.6.7.5.       Production plant

16.6.8.      Mahindra & Mahindra

16.6.8.1.       Company Overview

16.6.8.2.       Sales Volume

16.6.8.3.       Market Share movement

16.6.8.4.       Product Portfolio and Analysis

16.6.8.5.       Production plant

16.6.9.      Maruti Suzuki

16.6.9.1.       Company Overview

16.6.9.2.       Sales Volume

16.6.9.3.       Market Share movement

16.6.9.4.       Product Portfolio and Analysis

16.6.9.5.       Production plant

16.6.10.         Nissan Motor

16.6.10.1.     Company Overview

16.6.10.2.     Sales Volume

16.6.10.3.     Market Share movement

16.6.10.4.     Product Portfolio and Analysis

16.6.10.5.     Production plant

16.6.11.         Renault

16.6.11.1.     Company Overview

16.6.11.2.     Sales Volume

16.6.11.3.     Market Share movement

16.6.11.4.     Product Portfolio and Analysis

16.6.11.5.     Production plant

16.6.12.         Skoda

16.6.12.1.     Company Overview

16.6.12.2.     Sales Volume

16.6.12.3.     Market Share movement

16.6.12.4.     Product Portfolio and Analysis

16.6.12.5.     Production plant

16.6.13.         Tata Motor

16.6.13.1.     Company Overview

16.6.13.2.     Sales Volume

16.6.13.3.     Market Share movement

16.6.13.4.     Product Portfolio and Analysis

16.6.13.5.     Production plant

16.6.14.         Toyota

16.6.14.1.     Company Overview

16.6.14.2.     Sales Volume

16.6.14.3.     Market Share movement

16.6.14.4.     Product Portfolio and Analysis

16.6.14.5.     Production plant

16.6.15.         Volkswagen

16.6.15.1.     Company Overview

16.6.15.2.     Sales Volume

16.6.15.3.     Market Share movement

16.6.15.4.     Product Portfolio and Analysis

16.6.15.5.     Production plant

16.6.16.         Others

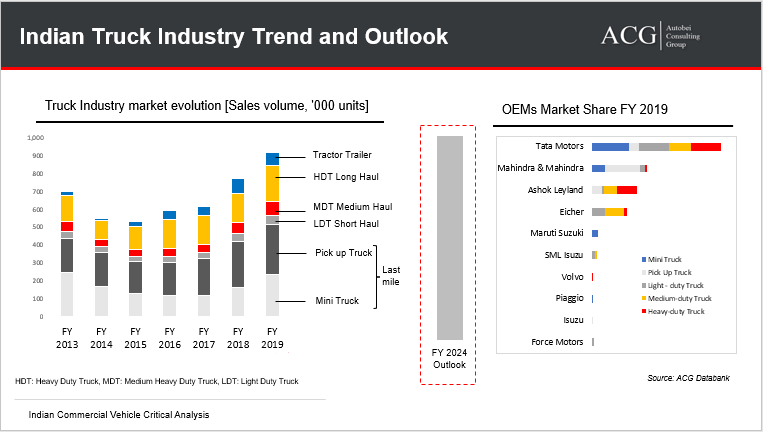
17.         Commercial Vehicle Analysis

17.1.          Total Indian CV Industry Market size – 2012 to 2017 (Unit & Value)

17.2.          CV Market Share Analysis in Indian Automobile Industry

17.3.          Sales Statistics

17.4.          Production Statistics

17.5.          Export Statistics

17.6.          Growth Analysis

17.7.          Key Market Drivers

18.         Segment Analysis

18.1.          Indian Commercial Vehicles: Market Classification

18.2.          OEM Strategy Analysis

18.2.1.      AMW Motors (Not in Operation)

18.2.1.1.       Company Overview

18.2.1.2.       Sales Volume

18.2.1.3.       Market Share movement

18.2.1.4.       Product Portfolio and Analysis

18.2.1.5.       Production plant

18.2.2.      Ashok Leyland

18.2.2.1.       Company Overview

18.2.2.2.       Sales Volume

18.2.2.3.       Market Share movement

18.2.2.4.       Product Portfolio and Analysis

18.2.2.5.       Production plant

18.2.3.      Force Motors

18.2.3.1.       Company Overview

18.2.3.2.       Sales Volume

18.2.3.3.       Market Share movement

18.2.3.4.       Product Portfolio and Analysis

18.2.3.5.       Production plant

18.2.4.      Isuzu Motors

18.2.4.1.       Company Overview

18.2.4.2.       Sales Volume

18.2.4.3.       Market Share movement

18.2.4.4.       Product Portfolio and Analysis

18.2.4.5.       Production plant

18.2.5.      Mahindra

18.2.5.1.       Company Overview

18.2.5.2.       Sales Volume

18.2.5.3.       Market Share movement

18.2.5.4.       Product Portfolio and Analysis

18.2.5.5.       Production plant

18.2.6.      Maruti Suzuki

18.2.6.1.       Company Overview

18.2.6.2.       Sales Volume

18.2.6.3.       Market Share movement

18.2.6.4.       Product Portfolio and Analysis

18.2.6.5.      Production plant

18.2.7.      Piaggio Vehicles Pvt Ltd

18.2.7.1.       Company Overview

18.2.7.2.       Sales Volume

18.2.7.3.       Market Share movement

18.2.7.4.       Product Portfolio and Analysis

18.2.7.5.       Production plant

18.2.8.      SML Isuzu Ltd

18.2.8.1.       Company Overview

18.2.8.2.       Sales Volume

18.2.8.3.       Market Share movement

18.2.8.4.       Product Portfolio and Analysis

18.2.8.5.       Production plant

18.2.9.      Tata Motors Ltd

18.2.9.1.       Company Overview

18.2.9.2.       Sales Volume

18.2.9.3.       Market Share movement

18.2.9.4.       Product Portfolio and Analysis

18.2.9.5.       Production plant

18.2.10.         VECVs – Eicher

18.2.10.1.     Company Overview

18.2.10.2.     Sales Volume

18.2.10.3.     Market Share movement

18.2.10.4.     Product Portfolio and Analysis

18.2.10.5.     Production plant

18.2.11.         VECVs – Volvo

18.2.11.1.     Company Overview

18.2.11.2.     Sales Volume

18.2.11.3.     Market Share movement

18.2.11.4.     Product Portfolio and Analysis

18.2.11.5.     Production plant

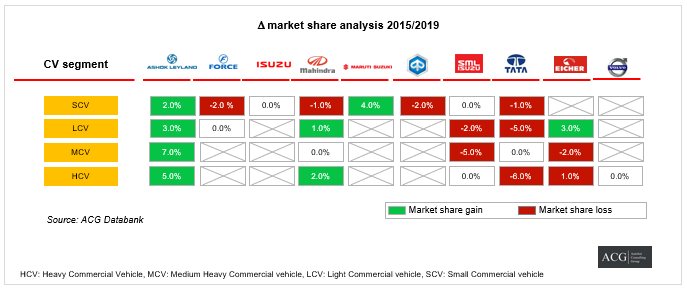
18.3.          Medium & Heavy Commercial Vehicle Analysis

18.3.1.      Market Size and Trend Analysis

18.3.2.      Segment and Market Share Analysis

18.3.3.      Growth Analysis

18.3.4.      Key players

18.3.5.      OEMs Strategy Analysis

18.3.6.      Tata Motors

18.3.6.1.       Company Overview

18.3.6.2.       Sales Volume

18.3.6.3.       Market Share movement

18.3.6.4.       Product Portfolio and Analysis

18.3.7.      AMW (Not in Operation)

18.3.7.1.       Company Overview

18.3.7.2.       Sales Volume

18.3.7.3.       Market Share movement

18.3.7.4.       Product Portfolio and Analysis

18.3.8.      VECV – Eicher

18.3.8.1.       Company Overview

18.3.8.2.       Sales Volume

18.3.8.3.       Market Share movement

18.3.8.4.       Product Portfolio and Analysis

18.3.9.      VECV – Volvo

18.3.9.1.       Company Overview

18.3.9.2.       Sales Volume

18.3.9.3.       Market Share movement

18.3.9.4.       Product Portfolio and Analysis

18.3.10.         SML Isuzu

18.3.10.1.     Company Overview

18.3.10.2.     Sales Volume

18.3.10.3.     Market Share movement

18.3.10.4.     Product Portfolio and Analysis

18.3.11.         Daimler Indian Commercial Vehicle (BharatBenz)

18.3.11.1.     Company Overview

18.3.11.2.     Sales Volume

18.3.11.3.     Market Share movement

18.3.11.4.     Product Portfolio and Analysis

18.3.12.         Scania Indian Commercial Vehicle

18.3.12.1.     Company Overview

18.3.12.2.     Sales Volume

18.3.12.3.     Market Share movement

18.3.12.4.     Product Portfolio and Analysis

18.3.13.         MAN Trucks India (Closed its domestic Operation)

18.3.13.1.     Company Overview

18.3.13.2.     Sales Volume

18.3.13.3.     Market Share movement

18.3.13.4.     Product Portfolio and Analysis

18.4.          Light Commercial Vehicle Analysis

18.4.1.      Market Size and Trend Analysis

18.4.2.      Segment and Market Share Analysis

18.4.3.      Growth Analysis

18.4.4.      Key players

18.4.5.      OEMs Strategy Analysis

18.4.6.      Tata Motors

18.4.6.1.       Company Overview

18.4.6.2.       Sales Volume

18.4.6.3.       Market Share movement

18.4.6.4.       Product Portfolio and Analysis

18.4.7.      Ashok Leyland

18.4.7.1.       Company Overview

18.4.7.2.       Sales, Production and Export Statistics

18.4.7.3.       Market Share movement

18.4.7.4.       Product Portfolio and Analysis

18.4.8.      Piaggio Vehicle

18.4.8.1.       Company Overview

18.4.8.2.       Sales, Production and Export Statistics

18.4.8.3.       Market Share movement

18.4.8.4.       Product Portfolio and Analysis

18.4.9.      VECV – Eicher

18.4.9.1.       Company Overview

18.4.9.2.       Sales, Production and Export Statistics

18.4.9.3.       Market Share movement

18.4.9.4.       Product Portfolio and Analysis

18.4.10.         Force Motors

18.4.10.1.     Company Overview

18.4.10.2.     Sales, Production and Export Statistics

18.4.10.3.     Market Share movement

18.4.10.4.     Product Portfolio and Analysis

18.4.11.         Isuzu

18.4.11.1.     Company Overview

18.4.11.2.     Sales, Production and Export Statistics

18.4.11.3.     Market Share movement

18.4.11.4.     Product Portfolio and Analysis

18.4.12.         Maruti Suzuki

18.4.12.1.     Company Overview

18.4.12.2.     Sales, Production and Export Statistics

18.4.12.3.     Market Share movement

18.4.12.4.     Product Portfolio and Analysis

18.4.13.         Daimler Indian Commercial Vehicle (BharatBenz)

18.4.13.1.     Company Overview

18.4.13.2.     Sales, Production and Export Statistics

18.4.13.3.     Market Share movement

18.4.13.4.     Product Portfolio and Analysis

19.         Two-Wheeler Industry Analysis

19.1.          Statistics and Qualitative Analysis

19.1.1.      Two-Wheeler Industry Volume Production

19.1.2.      Two-Wheeler Industry Volume Sales

19.1.3.      Two-Wheeler Industry Volume Export

19.1.4.      Market Share in Indian Automobile Industry

19.1.5.      Growth Analysis

19.1.6.      Key Market Driver

19.1.7.      Electric Two-Wheeler Overview

19.2.          OEM Strategy Analysis

19.2.1.      Bajaj Auto

19.2.1.1.       Company Overview

19.2.1.2.       Sales Volume

19.2.1.3.       Segment presence and Analysis

19.2.1.4.       Market Share movement

19.2.1.5.       Product Portfolio and Analysis

19.2.2.      Harley Davidson

19.2.2.1.       Company Overview

19.2.2.2.       Sales Volume

19.2.2.3.       Market Share movement

19.2.2.4.       Product Portfolio and Analysis

19.2.3.      Hero MotoCorp

19.2.3.1.       Company Overview

19.2.3.2.       Sales Volume

19.2.3.3.       Market Share movement

19.2.3.4.       Product Portfolio and Analysis

19.2.4.      Honda Motorcycle & Scooter

19.2.4.1.       Company Overview

19.2.4.2.       Sales Volume

19.2.4.3.       Market Share movement

19.2.4.4.       Product Portfolio and Analysis

19.2.5.      India Kawasaki Motors

19.2.5.1.       Company Overview

19.2.5.2.       Sales Volume

19.2.5.3.       Market Share movement

19.2.5.4.       Product Portfolio and Analysis

19.2.6.      India Yamaha Motor

19.2.6.1.       Company Overview

19.2.6.2.       Sales Volume

19.2.6.3.       Market Share movement

19.2.6.4.       Product Portfolio and Analysis

19.2.7.      Mahindra Two Wheelers

19.2.7.1.       Company Overview

19.2.7.2.       Sales Volume

19.2.7.3.       Market Share movement

19.2.7.4.       Product Portfolio and Analysis

19.2.8.      Piaggio Vehicles

19.2.8.1.       Company Overview

19.2.8.2.       Sales Volume

19.2.8.3.       Market Share movement

19.2.8.4.       Product Portfolio and Analysis

19.2.9.      Royal Enfield (Unit of Eicher Ltd)

19.2.9.1.       Company Overview

19.2.9.2.       Sales Volume

19.2.9.3.       Market Share movement

19.2.9.4.       Product Portfolio and Analysis

19.2.10.         Suzuki Motorcycle

19.2.10.1.     Company Overview

19.2.10.2.     Sales Volume

19.2.10.3.     Market Share movement

19.2.10.4.     Product Portfolio and Analysis

19.2.11.         Triumph Motorcycles

19.2.11.1.     Company Overview

19.2.11.2.     Sales Volume

19.2.11.3.     Market Share movement

19.2.11.4.     Product Portfolio and Analysis

19.2.12.         TVS Motor Company

19.2.12.1.     Company Overview

19.2.12.2.     Sales Volume

19.2.12.3.     Market Share movement

19.2.12.4.     Product Portfolio and Analysis

19.3.          Motorcycle Industry Analysis

19.3.1.      Motorcycle Industry Sales Volume

19.3.2.      Market Share in Indian Automobile Industry

19.3.3.      Growth Analysis

19.3.4.      Key Market Driver

19.3.5.      Motorcycle OEM Market Analysis

19.3.5.1.       Bajaj Auto

19.3.5.1.1.     Sales Volume

19.3.5.1.2.     Market Share movement

19.3.5.1.3.     Product Portfolio and Analysis

19.3.5.2.       Harley Davidson

19.3.5.2.1.     Sales Volume

19.3.5.2.2.     Market Share movement

19.3.5.2.3.     Product Portfolio and Analysis

19.3.5.3.       Hero MotoCorp

19.3.5.3.1.     Sales Volume

19.3.5.3.2.     Market Share movement

19.3.5.3.3.     Product Portfolio and Analysis

19.3.5.4.       Honda Motorcycle & Scooter

19.3.5.4.1.     Sales Volume

19.3.5.4.2.     Market Share movement

19.3.5.4.3.     Product Portfolio and Analysis

19.3.5.5.       India Kawasaki Motors

19.3.5.5.1.     Sales Volume

19.3.5.5.2.     Market Share movement

19.3.5.5.3.     Product Portfolio and Analysis

19.3.5.6.       India Yamaha Motor

19.3.5.6.1.     Sales Volume

19.3.5.6.2.     Market Share movement

19.3.5.6.3.     Product Portfolio and Analysis

19.3.5.7.       Mahindra Two Wheelers

19.3.5.7.1.     Sales Volume

19.3.5.7.2.     Market Share movement

19.3.5.7.3.     Product Portfolio and Analysis

19.3.5.8.       Royal Enfield (Unit of Eicher Ltd)

19.3.5.8.1.     Sales Volume

19.3.5.8.2.     Market Share movement

19.3.5.8.3.     Product Portfolio and Analysis

19.3.5.9.       Suzuki Motorcycle

19.3.5.9.1.     Sales Volume

19.3.5.9.2.     Market Share movement

19.3.5.9.3.     Product Portfolio and Analysis

19.3.5.10.     Triumph Motorcycles

19.3.5.10.1.     Sales Volume

19.3.5.10.2.     Market Share movement

19.3.5.10.3.     Product Portfolio and Analysis

19.3.5.11.     TVS Motor Company Ltd

19.3.5.11.1.     Sales Volume

19.3.5.11.2.     Market Share movement

19.3.5.11.3.     Product Portfolio and Analysis

19.4.          Scooter OEM Market Analysis

19.4.1.      Scooter Industry Market Size

19.4.2.      Market Share in Indian Automobile Industry

19.4.3.      Growth Analysis

19.4.4.      Key Market Driver

19.4.5.      OEM Strategy Analysis

19.4.5.1.       Piaggio

19.4.5.1.1.     Sales Volume

19.4.5.1.2.     Market Share movement

19.4.5.1.3.     Product Portfolio and Analysis

19.4.5.2.       Hero MotoCorp

19.4.5.2.1.     Sales Volume

19.4.5.2.2.     Market Share movement

19.4.5.2.3.     Product Portfolio and Analysis

19.4.5.3.       Honda Motorcycle & Scooter

19.4.5.3.1.     Sales Volume

19.4.5.3.2.     Market Share movement

19.4.5.3.3.     Product Portfolio and Analysis

19.4.5.4.       India Yamaha Motor

19.4.5.4.1.     Sales Volume

19.4.5.4.2.     Market Share movement

19.4.5.4.3.     Product Portfolio and Analysis

19.4.5.5.       Mahindra Two Wheelers

19.4.5.5.1.     Sales Volume

19.4.5.5.2.     Market Share movement

19.4.5.5.3.     Product Portfolio and Analysis

19.4.5.6.       Suzuki Motorcycle

19.4.5.6.1.     Sales Volume

19.4.5.6.2.     Market Share movement

19.4.5.6.3.     Product Portfolio and Analysis

19.4.5.7.       TVS Motor Company Ltd

19.4.5.7.1.     Sales Volume

19.4.5.7.2.     Market Share movement

19.4.5.7.3.     Product Portfolio and Analysis

20.         Indian Three-Wheeler Industry Analysis

20.1.          Statistics and Qualitative Analysis

20.1.1.      Three-Wheeler Industry Market size

20.1.2.      Market Share in Indian Automobile Industry

20.1.3.      Key Drivers

20.1.4.      Growth Analysis

20.1.5.      OEM Strategy Analysis

20.1.5.1.       Bajaj Auto

20.1.5.1.1.     Sales Volume

20.1.5.1.2.     Market Share movement

20.1.5.1.3.     Product Portfolio and Analysis

20.1.5.2.       Piaggio Vehicles

20.1.5.2.1.     Sales Volume

20.1.5.2.2.     Market Share movement

20.1.5.2.3.     Product Portfolio and Analysis

20.1.5.3.       TVS Motor

20.1.5.3.1.     Sales Volume

20.1.5.3.2.     Market Share movement

20.1.5.3.3.     Product Portfolio and Analysis

20.1.5.4.       Mahindra

20.1.5.4.1.     Sales Volume

20.1.5.4.2.     Market Share movement

20.1.5.4.3.     Product Portfolio and Analysis

20.1.5.5.       Atul Auto

20.1.5.5.1.     Sales Volume

20.1.5.5.2.     Market Share movement

20.1.5.5.3.     Product Portfolio and Analysis

20.1.5.6.       Piaggio Vehicles

20.1.5.6.1.     Sales Volume

20.1.5.6.2.     Market Share movement

20.1.5.6.3.     Product Portfolio and Analysis

20.1.5.7.       Scooters India

20.1.5.7.1.     Sales Volume

20.1.5.7.2.     Market Share movement

20.1.5.7.3.     Product Portfolio and Analysis

20.2.          Three-Wheeler Passenger Vehicle Analysis

20.2.1.      Three-Wheeler Passenger Vehicle Volume Sales

20.2.2.      Market Share in Indian Three-Wheeler Industry

20.2.3.      Growth Analysis

20.2.4.      Key Market Driver

20.2.5.      OEMs Strategy Analysis

20.2.5.1.       Bajaj Auto

20.2.5.1.1.     Sales Volume

20.2.5.1.2.     Market Share movement

20.2.5.1.3.     Product Portfolio and Analysis

20.2.5.2.       Atul Auto

20.2.5.2.1.     Sales Volume

20.2.5.2.2.     Market Share movement

20.2.5.2.3.     Product Portfolio and Analysis

20.2.5.3.       Mahindra & Mahindra

20.2.5.3.1.     Sales Volume

20.2.5.3.2.     Market Share movement

20.2.5.3.3.     Product Portfolio and Analysis

20.2.5.4.       Scooters India

20.2.5.4.1.     Sales Volume

20.2.5.4.2.     Market Share movement

20.2.5.4.3.     Product Portfolio and Analysis

20.2.5.5.       TVS Motor

20.2.5.5.1.     Sales Volume

20.2.5.5.2.     Market Share movement

20.2.5.5.3.     Product Portfolio and Analysis

20.3.          Three-Wheeler Cargo Carrier Analysis

20.3.1.      Three-Wheeler Goods Carrier Volume Sales

20.3.2.      Market Share in Indian Three-Wheeler Industry

20.3.3.      Growth Analysis

20.3.4.      Key Market Driver

20.3.5.      OEM Strategy Analysis

20.3.5.1.       Bajaj Auto

20.3.5.1.1.     Sales Volume

20.3.5.1.2.     Market Share movement

20.3.5.1.3.     Product Portfolio and Analysis

20.3.5.2.       Atul Auto

20.3.5.2.1.     Sales Volume

20.3.5.2.2.     Market Share movement

20.3.5.2.3.     Product Portfolio and Analysis

20.3.5.3.       Mahindra & Mahindra

20.3.5.3.1.     Sales Volume

20.3.5.3.2.     Market Share movement

20.3.5.3.3.     Product Portfolio and Analysis

20.3.5.4.       Scooters India

20.3.5.4.1.     Sales Volume

20.3.5.4.2.     Market Share movement

20.3.5.4.3.     Product Portfolio and Analysis

20.3.5.5.       TVS Motor

20.3.5.5.1.     Sales Volume

20.3.5.5.2.     Market Share movement

20.3.5.5.3.     Product Portfolio and Analysis

21.         Conclusion


ACG forecast center released the Global Light vehicle sales trend and Forecast. The following points are covered in this report:

Global Light Vehicle Sales Trend and Outlook

  • The market size of Light vehicle in since 2015 and changes over the next 5 years along with Growth de-growth rate
  • Industry Key market drivers
  • Challenges and Market dynamics
  • Key vendors and their space
  • Expected Technology changes
  • Vehicle Platform information
  • Top 10 countries
  • Short note on Qualitative analysis and Industry overview
  • OEM wise Sales and Production volume
  • Key Players

Geography covered: NAFTA, the Middle East, Europe, Asia, Africa, and South America. The data is available monthly, quarterly, half yearly and Yearly.

The industry of Indian automobiles came down by 14 percent in the month of March 2019 as compared to the same month of last year that March 2018. The rate of production also saw a downfall by about 18 percent but the good thing is that the export rose up by 4 percent.

Indian Automotive Industry Overview March 2019

Passenger Vehicle Market:

A downfall of 3 percent in domestic sales and 6 percent in export was seen by the industry of Indian passenger vehicle in the month of March 2019 as compared to March 2018. The sales of cars were down by 7 percent. The segment of SUV and MUV came down by 2 percent. But on the other hand, the segment of van rose up by 14 percent. In the export of PV, all saw a downfall except the segment of the van.

Indian Car SUV MUV and Van market overview March 2019

The sales of cars were down by 7 percent. The segment of SUV and MUV grew by 2 percent. The segment of van rose up by 14 percent. In the export of PV, all saw a downfall except the segment of the van.

In the month of March 2017, a total of 174 units of Tata Nano was sold, but in March 2018, a total of 29 units was sold and in March 2019, there is no production at all.

The segment of mini car size reduced by more than about 50 percent in the previous month of the financial year of FY 19. In this segment, Maruti is the market leader with about 74 percent of the market share. On the other hand, Renault also increased its market share from 12 percent to 26 percent.

The segment of the compact car rose up by 10 percent in the month of March 2019. The total combined market share of Maruti and Hyundai is about 81 percent. This is certainly one of the largest and most competitive segments in the Indian car market. The market share of Maruti rose up by 5 percent and that of Hyundai came down by 2 percent in the same segment. The second-best performer in the same segment is Honda who increased its market share from 2.7% to 6.2%.

To make its presence quite effective in the compact car portfolio, Tata necessarily needs to add more products. In the month of March 2019, Tata lost more than about 3 percent of its market share.

Coming to the segment of super compact, it experienced a downfall of about 44 percent in the month of March 2019 as compared to March 2017. In this segment, Toyota is certainly the ultimate leader with 91 percent of the total market share.

The segment of the mid-size car saw a downfall by 17 percent in the month of March 2019. Volkswagen seems to be struggling a lot in this segment where it’s market share remained constant at 3.7 percent exactly the same as compared to March 2018. Toyota in the same segment had about 2.8 percent of share. The top players of this segment other than Hyundai, Maruti as well as Honda, lost more than about 2 percent share of the market.

Talking about the segment of an executive car, it saw a massive growth by about 280 percent which is just phenomenal. The top performer in this segment is Hyundai which is in clear control of 80 percent share of the market in this particular segment. Both Volkswagen, as well as Toyota, lost its grip in this segment of an executive car.

The segment of the premium car increased by 19 percent in the month of March 2019. The previous leader in this segment was Skoda who lost 10 percent of share in this segment whereas Volkswagen has increased its market share in this segment by 10 percent with its popular Passat model.

The segment of affordable SUV and MUV saw a downfall of 13 percent in the month of March 2019 as compared to the same month in the previous year that is March 2018. Maruti, Tata Motors, Hyundai and Mahindra are top gainers in this market segment because of the fact of their strong product portfolio as well as their position.

The segment of premium SUV came down by 8 percent in the month of March 2019. Jeep emerged to be the leader of the market in March 2018 with about 43% percent share of the market share but as per the present results that are in the month of March 2019, Jeep lost about 12 percent of its market share. The one to replace Jeep from the position of the leader of the market was Toyota Fortuner who had about 42 percent share of the market.  Both Ford, as well as Mahindra, also increased their share in the market in the respective segment.

Coming to the segment of sports SUV, Skoda increased about 22 percent of market share where it came up from 55 percent to 77 percent. Both Volkswagen and Toyota lost 25 percent and 1 percent market share in the segment respectively.

The market segment of van including both mainstream and personal transportation was on the rise at the time of turbulence of car and SUV/MUV segment in the month of March 2019 where it saw a registration of about 27 percent of segment share.

Commercial Vehicle Market:

No significant changes are noted in the segment of Indian commercial vehicle in the month of March 2019 when compared with the same month of the previous year that is March 2018. The segment of the bus saw a growth of 4 percent but in the segment of the truck, the changes are hardly noticeable. To a great surprise, the segment of tractor trailer witnessed a downfall of 28 percent. Similarly, the rigid truck segment also witnessed a downfall of 5 percent in FY 2019 year-end month.

Indian CV Market Overview March 2019

The segment of the mini truck increased by a very good 83 percent in the month of March 2019. Tata Motors increased 2 percent share of the market, but on the other hand, Mahindra saw a loss of 5 percent share in the segment of a mini truck. Moreover, Maruti also increased the market share in the segment from 7 percent to 11 percent.

Again, no changes are recorded in OEMs position in the segment of a pickup truck. The segment of LDT saw a downfall of 5 percent in the month of March 2019.

In the segment of LDT, Mahindra, Eicher and Tata Motors lost market share. The gainer in this particular segment is Ashok Leyland. The performance of SML Isuzu is neutral which kept its position constant as compared to March 2018.

In the segment of MDT, Eicher saw a downfall in their market share which was not expected since Eicher has a very strong & attractive portfolio in segment of MDT. In addition to this, it is considered as one of the strong players in some of the specific sub-segments of MDT. Moreover, the company also introduced a specific vehicle for the purpose of an E-commerce application.

The segment of the heavy-duty truck witnessed a downfall of 13 percent in the month of March 2019. In this segment, the 16.2 GVW Eicher lost 3 percent share of the market. The Industry segment overall increased by 10 percent.

In the segment of the 25T truck, a gain of 12 percent was registered and the sole gainer is Tata Motors who increased the share of market share in the category of 31T and above but registered a downfall of 24percent in the month of March 2019.

In the segment of the tractor-trailer, only the category of 40.2T to 44T registered growth in the month of March 2019.

The segment of the bus of 5T saw a downfall of 6 percent in the month of March 2019. The performance of the OEMs is mixed in this segment. Force Motors saw a gain in its market share.

The segment of medium-duty bus rose up by 4 percent and Eicher increased its market share from 21 percent to 24 percent in the month of March 2019.

The segment of heavy duty bus saw a growth of 8 percent. JBM gained about 3 percent market share whereas Tata Motors lost 4 percent.

About 16 units of buses were sold by Volvo in the month of March 2019.

Thus, it is evident from the above results that the performance is mixed in this particular segment.

Yearly Indian Automotive Reports and Data

Two Wheeler Market:

The two-wheeler industry of India saw a downfall of 18 percent in the month of March 2019. The segment of scooter witnessed 25 percent downfall and the segment of motorcycle witnessed 14% percent downfall as compared to the same month of the previous year that is March 2018.

Indian Two Wheeler Market Overview March 2019

In the segment of the scooter, all of the brand’s excerpt Suzuki saw degrowth. Suzuki saw a steady growth of 56 percent in the month of March 2019. The two of the major players in this particular segment Hero and Honda saw a downfall of more than about 40 percent.

After negative growth, TVS grew its market share from 7 percent to 16 percent in the category of 90 to 125 cc.

The segment of the basic motorcycle of 75 to 110 cc, Bajaj increased 6 percent market share and rose up by 31 percent. However, the de growth of the segment is 13 percent. In this segment, TVS also rose up by 21 percent and increased 2 percent market.

In the category of 110 to 125 cc, which is the largest segment of a motorcycle in terms of volume, witnessed a heavy downfall of about 43 percent in the month of March 2019.  But Hero and Yamaha increased their market share in this segment.

The segment of 125 to 150 cc rose up by 48 percent in the month of March 2019 with Bajaj as the key gainer in this category which increased its market share from 41 percent to 64 percent in the month of March 2019 as compared to the same month of the previous year that is March 2018.

The segment of 150 to 200 cc witnessed a downfall of 22 percent. The best performer in this segment is TVS Apace which increased its market share from 54 percent to 64 percent.

The segment of 200 to 250 cc witnessed a downfall of 25 percent in the month of March 2019. There are some major changes in the market share of the OEMs.

The segment of 250 to 350 cc saw a downfall of 22 percent in the month of March 2019. Royal Enfield made its grip quite stronger by increasing their market share in this particular segment from 97 percent to 99 percent which is just great.

The segment of 350 to 500 cc also noted a downfall of 63 percent in the month of March 2019. The two of the most important players in this segment that is Bajaj and Royal Enfield showed clear domination with 29 percent and 70 percent of the overall market share in this particular segment.

The segment of 500 to 800 cc showed an extremely good performance by registering a total growth of about 350 percent which is quite phenomenal. The market share of Royal Enfield rose from 21 percent to 89 percent which is a jump of about 68 percent in the market share.

The segment of 800 to 1000 cc rose up by 6 percent but this segment actually very small. In this segment, Kawasaki increased its market share from 38 percent to 60 percent.

The segment of 1000  to 1600 cc witnessed a downfall of 9 percent. But the segment of more than 1600 cc registered a growth of 66 percent in the month of March 2019. Honda and Harley Davidson are the two vital players in this segment.

Coming to the export data, the segment of 110 to 125 cc motorcycles rose up by 25 percent, the segment of 200 to 250 cc witnessed a downfall of 62 percent and the segment of 500 to 800 cc also rose up by 118 percent in the month of March 2019 which is quite good.

Contact to Info@autobei.com to get Monthly Subscription Plan. This is the most detail subscription package of Quantitive and Qualitative Automotive Analysis.

TVS is one of the oldest two-wheeler manufacturing brand in our country. TVS has earned the fame of being one of the most trusted, reputed and respected brands based in south India. The very famous and popular TVS 50 mopeds and TVS XL still continue to exist in the Indian market. But on the other hand, the then competitors of TVs such as LUNA, Hero Majestic and Suvega vanished from the Indian Moped industry a long time back which clearly proves the strong foothold of TVs in the Indian two-wheeler market.  The most important reason for this success of TVS 50 is mainly because of its very quick initial pick up, good capacity to carry the load and a wide range of service networks.  TVS 50 has a very good brand image in the automobile market of our country especially in south India which is evident from the fact that almost every house has a TVS 50 moped.

TVS Motor Market share Analysis

The company has also continuously upgraded the product on a regular basis which has necessarily kept the competition at bay. In the process of constant up-gradation, the main modification that was done in the moped is the change from Dry clutch to Wet clutch along with the increase of the cubic capacity. At present, TVS has two of its products which are TVS XL Super and Jupiter. Both of these products from TVS lie within the top bestselling two-wheelers in India and is still going strong in the market.

TVS has a wide range of products starting from the economical segment to the premium ones, thereby catering to the need of almost all customers at its best. TVS lives up to the expectation of its customers by constantly upgrading its products by addressing the feedback from the customers. This is one of the major strengths of the company. The earlier model TVS 50 is currently upgraded to TVS XL Super which comes with a 4 stroke 100cc engine and kicks start but still, it continues with the centrifugal clutch wet type. All of the customers would have the feel of Moped that is non geared along with its superb initial pulling which is the main reason to why the customers do not feel the need of going for a geared Bike. There are many villages in India where the customers still find it difficult to handle the geared bikes and this is exactly where the TVS XL Super comes handy for those customers.

The Scooty is another of the very successful model from TVS which is quite popular among the female folks. This model has undergone several upgradations and finally, the Scooty Pep which has a 90cc engine is one of the largest selling models in this specific segment. After struggling a lot to get the desired volume with WEGO which is the auto gear 110cc 4 stroke scooter that TVS has brought in JUPITER by keeping the capacity of the engine same as WEGO. There was a very little overall change in looks of the model which is on par with Activa from Honda and it was very well received by the customers. When this model JUPITER has launched the model Activa from Honda was not quite easily available across which is why the customers had to wait for long. This is exactly where TVS has encashed the situation with the launch of JUPITER. Slowly and steadily, it gained a respectful share in the market in the specific segment.

The overall performance of these models is satisfactory but the maintenance has always been a concern.  For instance, the life of centrifugal clutch assembly which is a part of the automatic transmission is comparatively on the lower side. It has been observed that for every 8,000 to 10,000 kilometers, the complete set needs to be a replacement. On the other hand, the other models such as Honda Activa, Yamaha RayZ whose life span of the centrifugal clutch assembly is almost double. This is exactly what TVS needs to investigate for living up the expectation of its brand image.

Coming to the motorcycle segment, TVS has consistently been at par with the market share of Apache whose range of bikes begins with 160cc to the recently launched RR 310 cc. These bikes lie in the category of power as well as premium. Talking about the economic and commuter segment, the models such as Sports, Star City+, Victor and Radeon do a reasonably very good job that caters to the needs of almost all customers. All the mentioned models are developed in the house because of the strong R&D back up. The company with the tie-up with BMW several new inputs has come across thereby making all of the products of TVS to become readily enhanced and world-class in terms of technology.

The major reason behind the fact is that TVS necessarily keeps all its dealers happy. The dealers of TVS are one of the most profitable dealerships when compared with the other brand dealers keeping the volume same. TVS takes very good care of its dealers and at the same time, TVS keeps a close eye to ensure that each of the dealers is abiding by the vision, rules, and regulations of the company without any flaws. This clearly indicates that TVS not cares for the dealerships but also makes sure that none of the customers of TVS get a chance to complain about any of the dealerships.

Customer Satisfaction Index - TVS Motor

TVS has a dedicated team for customer satisfaction index. This team is readily available across all the dealerships where they sure to conduct effective monitoring services. This makes it quite clear to us there is hundred percent involvement of the executives of the company with the dealerships for effectively addressing customer satisfaction at its best. Now, there are a few cases where the involvement of the CSI team surpasses the limit which costs the working manpower at the dealerships. It happens several times, where the executives of the CSI team of the company directly force the dealer to sack the manpower which they feel are not performing up to the mark and they cannot provide what is expected from them. In these types of cases, the dealers usually obey the executives of TVS for the avoidance of any kind of unnecessary confrontation with the company. In this regard, the direct involvement of the company with the working manpower at the dealerships becomes a great issue which might have an overall negative impact on the company. This can be considered as a type of mental tension for all of the employees who are working at the dealerships which might impact negatively in terms of performance as well as attrition.

As TVS vigorously participates in the races, it certainly has a competition to attract the customers who are crazy about the bikes that perform.

The Indian Car Industry will become the third-largest Car market in 2022. China and the US are the only car markets ahead of India. More than 4.5 million Passenger vehicles were produced in India in FY 2023. The Indian Automobile Market is expected to be the third-largest by 2030. The Indian Automobile market is one of the fastest-growing car markets, especially in the SUV segment.

ACG released the variants-wise Data. Variant-level Indian Car sales Data is our exclusive vehicle database. In the Car Industry, every model has different variants. Some variants are important in gaining remarkable market share, and some are only visible on the company website and brochure.

The number of Variants plays a critical role in a car-buying customer journey. How do you distinguish various variants with price gaps and decide the success of Models in the Indian car Industry? This is one reason some models’ sales volume is proportionate to the number of variants and some not.

ACG released the variants-wise Data. Following are the first-level vehicle categories:

  • Car
  • SUV, and
  • MUV segment

The data is further classified into the following vehicle types:

  • Sedan,
  • Hatchback,
  • Sports,
  • Premium,
  • Mini, etc.

Along with sales data, we also map the other relevant key information, like

  • Brand Name
  • Model name
  • Variant names
  • Engine capacity
  • Price – (On road Price & Ex Showroom Price)
  • Segment (C.B D, etc)
  • Fuel type
  • Wheelbase
  • Length
  • ABS
  • Special features
  • Basic features etc.

The database can be modified/customize also according to additional requirements.

This data gives access to the following advantages:

  • Product Planning & Strategy
  • Competitive Mapping
  • Price difference analysis in the same segment vehicle
  • To know the Top features of the vehicle
  • Customer buying preference choice
  • New Product launch and Phase out Strategy
  • Achieve to desired Sales Volume, Revenue, and market Share
  • Indian Car Segment and Sub Segment Analysis
  • PV Cluster – Based Price, Engine, and other parameters
  • Top “N” Model: Sales and Highest Revenue generation models

OEMs are included:

  • Maruti Suzuki
  • Hyundai
  • Toyota
  • Honda
  • Mahindra
  • Nissan
  • Renault
  • Volkswagen
  • Jeep
  • Citroen
  • Tata Motors
  • Audi
  • Porsche
  • Volvo
  • Mercedes
  • BMW
  • MG Motor
  • Ford and GM (Trend)
  • Skoda

ACG released the Indian Automobile Industry Year Book 2019 edition. The report covers Two Wheeler Segment (Scooter, and Motorcycle), Passenger Vehicle segment (Car, SUV, MUV, and Van), Commercial Vehicle Segment (Truck & Bus), Three Wheeler Segment, and Electric Vehicle. There is a separate report on each segment is also available. This Automobile handbook gives you quick access to any latest information for taking the key decision. The graphs and presentation of the book are designed to provide easy access to any stakeholder of the Indian Automobile Industry stakeholder.

The report contains both Quantitative and Qualitative Analysis. Following points are the part of the report:

  • Country Analysis – India
  • Production, Sales and Export volume of segment & Sub-segment
  • Market Share movements of each segment
  • New Product launches
  • Key Advertising campaign
  • 30 OEMs company profile
  • Macro Economy and Forecast
  • Major movements in volume and market share
  • Company wise Analysis
  • Govt policies and regulations and their impact
  • SWOT Analysis
  • Overview of Market dynamics

Special Edition of the book is also available which include critical data analysis and market intelligence information.

It is an interesting fact to learn how the market fluctuates due to various factors. There are multiple factors which will define the growth rate as well as the decline of the brand in the market. We analyze multiple factors which affect the sale rate in the market. The customers or the clients influence whether the brand can succeed in the market or cease to decline in the market.

Why sub-segment categorization and Qualitative Analysis is required for automotive forecasting

  • In 2010, European commercial vehicle Manufacturer decided to enter into Indian Truck Market. They started to play with data of the Truck segment and sub-segment.  They found that 31T GVW segment is a fastest growing segment and they decided to launch their own product of that segment the 31T and the 8X4 tipper which Can be utilized for mining application, but they failed drastically, and it was hard for the brand to reach a sale count of ten units. The Company did not analyze the segment and its sub-segment trends in the market and the forecast prepared for that sector. They did not give importance to the point that the market was growing of 8X2 Rigid haulage segment and not the Tipper segment.
  • The other main reason for the failure of the product was not analyzing the forecast regarding the uses of products. Launching 8X4 Tipper also failed to impress the customers. The companies should also check actual uses of the product along with other factors like overloading and product performance. This European product was not fit for mining application; it was fit only for an on-road application like Construction. The whole forecast was not done in a proper manner. This improper forecasting which leads to the failure of a brand.
  • In this case, we analyze the reason for downfall when the company or company’s agency only qualitative research. One German Company was planning to launch its premium car model in India. They made a projection that this is not a car, but it is a lifestyle, it’s a brand symbol and they made advertisement by branding the vehicle to lead the life. By devising some assumptions, the company structured a good forecast for an improved volume of sale rate of this model. The company considered the factors like specific car image, competitor’s product position in the market, differentiation, the mindset of the Customer to buy heavy powered vehicles. They did not think about segment volume, segment size, and the company also failed to do a growth analysis for the product in comparison to its competitors. The failure in analyzing the above-mentioned factors resulted in the drastically failure by the company to achieve its target volume. The forecast does not give effective result if all attributes do not consider the factors affecting the sale.

ACG assisted almost all major OEMs, Suppliers, and key stale holders for forecasting the volume and trend of the market. Our precise forecast helped them to take the right decision at the right time. The demand forecast is an important factor in making a strategic decision.

ACG use more than 30 parameters in forecasting which will give the more precise result of future trends and market parameters for better sale rate. The following are a few factors which can affect the market trend:

  • Defining the market trends
  • Brand Development index
  • Divide total industry demand into its main components.
  • Forecasting the drivers of demand in each segment
  • Project the factors of how each driver demands are likely to change.
  • Conduct sensitivity analysis regarding the product to understand the most critical assumptions and to gauge risks to the baseline forecast.
  • Direct interaction with potential buyers, check customer pulse and sentiments
  • New product launch response among the customers
  • Do a study of the macroeconomy and economy performance of the market
  • Policies and norms affecting the sale rate
  • Population mix and their needs
  • Living standard and how it affects consumer mentality
  • Infrastructure for vehicle maintenance
  • Policy changes
  • Cost
  • Technology improvement
  • Offers by brand
  • Competitor strategy
  • Product improvisation
  • Brand value
  • Environmental factors
  • Geographical factors and many other factors.

The forecast methodology is a complex process and the changes are often based on the market dynamics. We develop and prepare forecast at Industry, Segment, Sub-segment, OEMs, Model, and variant level.

Global Automotive Forecast Report

In Geographical terms, we cover more than 50 markets across the world. The forecast available at Global, Country, State, and City level. Besides the volume forecast, we also do the qualitative analysis in which we analyze customer’s purchase behavior and the reasons for the shift in their behavior factors which could influence the buying behavior, brand acceptance, brand perception, Product quality, Product testing, brand value, and many other factors.

Indian Automotive Forecast Analysis

In some circumstances, we prepare two different cases of the forecast. One could be prosperity and the other one will be based on the recession or based on two different GDP projections.

ACG developed its own matrix for the automotive Industry forecast. Year on year, our forecast is getting closer to actual market condition. We have a forecasting department who work around the year on this subject which helps us accurate and current forecast details of the market structure.

Even when the work is sound, though, uncertainties will remain as vacuum point. The best way in forecasting is to keep a watch on each development of markets and update the forecast based on the developments. The firms have a thought process and framework will have a better chance of finding these discontinuities and develop a chance for improved sale rate than those who do not will find it difficult to keep a hold in the market. And those who have their business strategies on a solid knowledge of demand will stand a much greater chance of making a wise investment, planning, and competing effectively.

Since we do forecasting on not only volume but also in terms of the worth of the product. We can calculate the future revenue of the firms based on the factors defining the sale. Our exclusive forecast service gives access to gauge the impact on demand forecast like increasing the promotion budget, increasing the distribution coverage, price changes, an extension of product line and so on. As per our previous forecast projects, at some point, the promotion strategy and other described filter will have a peak impact on the market value of the product and after that threshold limit market value does not increase sales after some specific point.

Doing specific forecast is also part of our services like doing forecasting for a vehicle with Air suspension or bogie suspension or vehicle fitted with automated climate control device etc.

Indian Car Market Forecast Report

We include car, passenger vehicle, commercial vehicle, truck, Bus, two-wheeler, three-wheeler, and other automotive components and products in our catalog of services. Forecasting will always remain the prime factor in brand success. The more accurate it is more benefits the brand will gain.

Indian Commercial Vehicle Market Forecast Report

We provide a Quarterly Sales and Production forecast. Please contact us to get Global critical Model and City forecast.

Overview of Indian Automotive Market in February 2019 and Cumulative

The sale of automobiles is facing a bit slow down in Feb 2019 which is temporary in nature and is due to an election which is about to take place in the next month. Apart from the phase of pre-election, there are several other factors such as tight liquidity condition which plays a major role in impacting the behavior of the consumers.

The market of automobiles is continuing to exhibit the subdued demand sentiments because of the fact of high-interest rates, slowing economic activity, the lagging effect of implementation of new norms for axle load, decreasing index of IIP growth and the slowing industrial output. In addition to this, the base effect is also a major factor that plays an important role in the very slow growth of the CV industry with respect to H2 of the financial year 2018.

After the implementation of the new norms for axle load, the freight carrying capacity of MHCV parc has gone up by twenty percent, but on the other hand, the freight growth has not been able to take this enhanced capacity. This, in turn, has resulted in decreasing demand for the new trucks. Now, talking about the segment of tipper has kept on showing a very good growth of about 22 percent on the back of road construction, irrigation as well as affordable housing projects.

This is one of the segments which has not been affected very much by the changing of the axle load norms. The introduction of the new products in the very quick growing segment of 15 T – 16 T is seen to have been accepted by the customers very well. The demand in a segment of M & LCV has been readily propelled by the e-commerce sector as well as increased rural consumption both of which is very well supported by the introduction of the new products.

Coming to SCV Cargo and the segment of the pickup was back in form in the previous month that is February 2019. With the evolution of the hub-spoke model, the increasing want for the last mile connectivity across the rural as well as the urban markets, along with the initiatives of Swachh Bharat have led to the rise in demand in this segment.

The launch of New Product & Market updates

Honda Cars India has finally launched the All New 10th Generation Honda Civic in the Indian market which is its iconic and much-awaited model This new launch Honda Civic promises to deliver the users with an all driving experience. The car with its fantastic sporty design, great driving performance, an advanced set of key technologies as well as innovations along with premium quality and an upscale interior is all set to give the users complete satisfaction. The model Civic from Honda is the longest – running automotive nameplate and its largest selling model throughout the world.

The model Harrier which is an SUV from Tata Motors has received a very good response in the Indian market. Tata Motors is expecting to increase its production volumes in the months to come. Tata Motors grabbed the order of a total of 1045 buses from Gujarat State Roadways Transport Corporation which included 695 fully-built Midi-buses and 350 12m chassis. Another order which was more than about a thousand Winger Ambulances that are AIS 125 standard complaint from the governments of Uttar Pradesh, Gujarat, Himachal Pradesh, and Haryana. In addition to this, about 812 was received in the last quarter from the government of Uttar Pradesh and 400 CNG BRTS buses from Pune Mahanagar Parivahan Mahamandal Ltd. (PMPML).

Indian Automotive Feb 2019 Analysis report

Passenger Car, SUV, MUV, and Van Industry Overview

In the month of February 2019, the Indian automotive market showed very low degrowth of about four percent in sales and about two percent declination in production. On the other hand, the export showed a growth of about four percent. However cumulative, the Indian automotive production market showed nine percent growth, sales showed a rise of seven percent and the export registered a total growth of 16. In the last month, a total of 1,71,372 cars were sold which was four percent decline whereas the segment of SUV/MUV registered a growth of four percent where there was a sale of 83,245 units. Cumulative, the segment of car sales showed growth of three when compared to the same time period in the previous year. The segment of SUV and MUV rose by two percent and the segment of van rose by thirteen percent when compared with the same time period in the previous year.

The segment mini Car showed a sharp declination of 33 percent in February 2019 as compared to February 2018. However, the share of the two major OEMs that is Maruti & Renault rose from 76 percent to 83 percent and from 14 percent to 17 percent respectively in this sub-segment.

The segment of the compact car increased by 2 percent, where the vital players are Maruti, Hyundai, and Tata Motors. The market share of Hyundai in this segment is stagnant but the share of Marui share increased by 2 percent and the share of Tata Motors decreased by 2 percent whereas in this segment the share of Honda just simply doubled in February 2019. The segment of super compact fell thirteen percent as compared to the same month of the previous year. The mid-size segment is another of the major one which in February 2019 showed a declination of 21 percent when compared with February 2018. But the shares of Honda, Hyundai, and Skoda rose by two, one and three percent respectively in the month of February. But the struggling player Volkswagen showed a massive growth of more than doubling its market share in the last month.

The segment of affordable SUV that is Maruti, Mahindra and Hyundai ended with an increased market share in the last month. Tata Motors gained two percent market share and this segment showed growth of one percent in the previous month as compared to February 2018 which is the key highlight. A growth of 25 percent was shown by the budget segment but on the other hand, the premium segment of SUV/MUV showed negative growth. Jeep which is one of the most successful models also started losing its grip incurring a loss of ten percent market share. The market share of Fortuner is almost the same without any movement.

Commercial Vehicle Industry Feb 2019

The market of Indian commercial vehicle also remained the same in the month of February 2019. The segment mini truck showed a growth of 18 percent as compared to February 2018. In this segment, Maruti Suzuki Supercarrier attracted a lot of customers from its competitors. Market share lost by Tata Motors & Mahindra was three and one percent respectively Suzuki gained four percent market share. Overall, the segment showed growth by 18 percent in February 2019 as compared to February 2018.

The segment of pickup truck rose by one percent in February 2019 as compared to February 2018. In this segment, Mahindra and Tata Motors both lost one percent market share.

The light duty truck also fell by one percent. In the segment of 3.5T to 6T, Eicher lost two percent and in the category of 6 to 7.5T Eicher lost seven percent market share in February 2019. In the same sub-segment, the gain of market share was two percent by Ashok Leyland.

The segment of the medium-duty truck rose by seven percent in February 2019. Eicher showed a loss in its grip in the segment of MDT. In the same segment, the other majors such as Ashok Leyland, Tata Motors showed a better performance.

The segment of the heavy-duty truck fell by fourteen percent in February 2019 as compared to February 2018. In HDT, the rigid truck segment showed a negative growth of three percent in February 2019. The segment of 31T and above 31T GVW recorded the highest negative growth of 21 percent in this subcategory but in another segment showed good growth.

The performance of Ashok Leyland is quite a good one which has increased its market share in each of the sub-segments. On the other hand, Tata Motors which is its closest competitor lost market share in each of the sub-segment of Rigid HD segment.

Negative growth of 35 percent was noticed in the tractor-trailer segment in February 2019.

The segment of the bus is the same and no changes are noticed in terms of the volume of buses. In the segment of 5T, Tata Motors ranked first which registered an increase in market share of 20 percent from 16percent to 36 percent. 17 percent market share was lost by Force Motors which came down to 52 percent from 69 percent.

Another of the sub-segment of 5T and seating capacity of more than 13 saw negative growth of 15 percent but Force Motors is a gainer in this segment.

The segment of the medium-duty bus of 5 to 7.5T registered a growth of seven percent whereas Eicher, Tata Motors and Force Motor lost market share of 2 percent, 3 percent & 1 percent respectively. The segment of the medium-duty bus of 7.5T to 12T showed a negative growth of three percent. At the same time, Tata Motors and SML Isuzu lost market share in February 2019 as compared to February 2018. The segment of heavy-duty bus showed a growth of 8 percent where Ashok Leyland gained 12% market share from 55 to 67% and Tata Motors lost 11% market share.

Indian Automotive Annual Subscription Package

Indian Two Wheeler Industry Feb 2019

The industry of Indian Two-Wheeler showed a negative growth of five percent in the month of February 2019. The segment of scooter increased by one percent but the segment of the motorcycle segment came down by 12%. In the category of 75 to 125cc, the market share lost by Honda was four percent and Suzuki gained a market share of five percent February 2019. The market share of TVS remained constant at 15 percent. In the category of 75 to 110cc, the segment of motorcycle rose up grew by eight percent in February 2019 as compared to the same month of the last year.

In the category of 110 to 125cc, the negative growth was of 17percent. In this category, the market share lost by Hero MotoCorp was six percent whereas the market share of Honda increased by 12 percent in February 2019.

In the category of 125 to 150cc, there was a growth twelve percent in which Bajaj increased market share from 42% to 59% but the loss of market of Honda was 16 percent. In the category of 150 to 200cc, there was a negative growth of 13 percent in February 2019 as compared to February 2018. Here the gain in market share by TVS was 9 percent but Suzuki and Honda lost market share by 8 percent and 5 percent respectively.

In the higher segment of 200 to 250cc, there was degrowth of 61 percent where Yamaha gained 3 percent market share and Bajaj lost 5 percent market share. In the category of 250 to 350cc, there was again a negative growth of 15 percent where Royal Enfield was the supreme dominator the segment with 99% market share. In the category of 300 to 500cc, the degrowth was 67 percent where Royal Enfield showed an improvement in its performance by gaining 11% market share. In the category of 500 to 800cc, there was a growth of 415 percent in February 2019.

In the three-wheeler segment, a negative growth of four percent was registered. The segment of passenger three-wheeler showed degrowth of four percent and the goods three-wheeler segment showed growth of six percent.

Please contact us to get Monthly Automotive Detail Analysis