Product Life cycle (PLC) plays a key role in Automotive Business, Marketing, Pricing, Sales, Market Share, and Product Development Strategy.

We have analyzed more than 10,000 models and 70 countries of all major OEMs. Report cover Car, SUV, VAN, Truck, Bus, and Two Wheeler worldwide. Our big data analysis links with qualitative analysis to draw a precise conclusions.

Automotive Industry Product life cycle Analysis report is available country wise and OEM wise. It is interesting to find the relation between how sales and market share are interlinked with PLC.

Another section describes the magical price points in every part of the Product life cycle like Introduction, Growth, Maturity, and decline.

Region: Asia, Middle East, Europe, Africa, NAFTA, Latin America, and the rest of the world.

Key highlights of the report:

  • Introduction of the Production life cycle for Automotive Industry
  • Competitive Analysis of PLC
  • How PLC impact business strategy
  • OEMs product Strategy Analysis
  • Brand and Product life cycle Analysis
  • Gap Analysis
  • How to profit can be increased with the right strategy of the Product life cycle
  • How pricing need to be changed as per the stage of the product life cycle
  • How to create the next level of product blueprint
  • Technology and Product strategy
  • Buying process and PLC
  • Different case studies

We help major Automotive companies in almost every country to create effective Product planning, Analyzed the Product life cycle and create a basis for next-level product strategy.

Electric Vehicle Market and Product Strategy for Electric Two-Wheeler, Electric Car, Electric Bus, and Electric Three Wheeler is a detailed study that combines quantitative and qualitative analysis. The report is prepared based on Desk Research and survey with more than 5,000 potential EV buyers of 25 cities.

Key Highlights of the report:

  • EV types and uses of the vehicle
  • EV latest Status and Industry updates
  • How EV Startups and existing players penetrate the market with their offering
  • How to create product strategy, planning, portfolio, and launching strategy
  • Map product portfolio with market Demand
  • Short, medium, and Long term demand analysis – EV and PHEV
  • Existing and upcoming new vehicle position, Specs, Features, Price, and customer feedback
  • Current Slow and fast charging infrastructure
  • Strategic location for charging station
  • How to design the product as per city requirement and application
  • What we would be the reasonable price for Electric vehicles?
  • Who would be involved to buy Electric Vehicle?
  • How to increase the value of the electric vehicle without reducing the price
  • What are the features buyers are looking in Electric car
  • How Brand position is playing a role to buy a new vehicle
  • How to present the benefits of Electric vehicle and map it with customer need or wants
  • Target Customer Analysis – What to offer and how to offer
  • How to make a Business plan for Electric Vehicle
  • How to EV performance measure by the buyers
  • How to create awareness about EV
  • How to design the campaign and set the objective
  • What is the impact of Govt policies on Electric vehicle sales
  • Major players in Electric vehicle – Two Wheeler, Car, Bus, and Three Wheeler
  • EV cost component Analysis
  • Channel Sales Strategy
  • Operating cost analysis
  • Case study – Mahindra EV and Tesla

ACG is going to release the report on the Indian Tyre market Analysis. We included all stakeholders of the Industry.

Following are the key highlights of the report:

  • Current Tyre market scenario and Forecast
  • Opportunity and risk Analysis
  • Market Potential Assessment
  • Impact of Chinese & Japanese Tyre manufacturer in India
  • Vehicle Type: Passenger Vehicle, Truck, Bus, Two Wheeler, and Three Wheeler
  • Application wise – On the, off road, Mining, Agriculture, Industrial Tyre
  • Indian Tyre Market size for each application
  • Market trend – Low price, Budget, and Premium tyre segment
  • Product portfolio and customer segment Analysis for each segment
  • Price Analysis for each application and segment
  • Key players
  • Market Share in each tyre size
  • Key Tyre size and pattern
  • OE Trend Analysis
  • Tyre life Analysis
  • Customer preference
  • Number of Tyres and Axle load analysis for  Commercial vehicle
  • The tyre buying process and decision for each segment
  • How Brand perception and image play a role in the customer’s mind
  • Retreading tyre Industry Analysis
  • Regulation for Tyre uses
  • Entry Strategy for New company into Indian Tyre Market
  • Case study on the tyre industry

ACG published the Indian Automotive Industry Analysis HY1 FY 2020 report. The report covers various Industry factors that are relevant to the Indian Automotive Industry.

The Indian Automotive Industry showed negative growth in all Automobile categories in HY1 FY 2020 compared to HY1 FY 2019.

Sales: HY 1 FY 2020 Indian Automobile Industry registered 17%, Commercial Vehicle 23%, MHCV 36%, LCV 15%, Passenger vehicle 24%, Two Wheeler 16%, and Three Wheeler 7% degrowth.

Production: HY 1 FY 2020 Indian Automobile Industry registered 13%, Commercial Vehicle 27%, MHCV 38%, LCV 19%, Passenger vehicle 16%, Two Wheeler 13%, and Three Wheeler 8% degrowth.

Export: HY 1 FY 2020 Indian Automobile Industry registered 1% growth,  Passenger vehicle 4% growth, Two Wheeler 4% growth, Commercial Vehicle 42%, MHCV 53%, LCV 31%, and Three Wheeler 12% degrowth.

In the Passenger Vehicle segment, Hyundai gained 6% market share in HY1 FY 2020 due to its newly launched product position and customer acceptance.

Indian Car Market Analysis HY1 FY 2020

Key highlights of the report:

  • Indian Automotive Industry overview
  • Sales, Production, and Export volume
  • Automotive Segment and Sub-segment Analysis
  • Reseason for changing the volume or Segment share
  • Macro Economy impact and Automotive Analysis
  • OEM detail Analysis along with the business review
  •  Customer sentiments and buying power
  • Analysis Included Passenger vehicles, Truck, Bus, Commercial vehicles, Scooter, Bikes, and Three Wheeler
  • New Product launched an impact on sales, market share,  and customer response
  • 40 OEMs Detail Analysis Trend and Forecast
  • Segment-wise Product Strategy
  • Next Quarter Industry Outlook

A monthly Automotive Subscription service is also available. Please contact us to get every update on time with Analysis Report and Data.

ACG is going to release the African Car market analysis and forecast 2024. This is a detailed Market Assessment of the South Africa passenger car market.

The Key highlights of the report:

  • The South African Car market Size
  • Types: Sedan, Hatchback, SUV, and Luxury
  • Sales, Production, and Export Analysis
  • last 5-year trend and Short, Medium, and Long term Outlook
  • Chinese OEMs impact in the South African Market
  • European, Indian, and American OEM Strategy for South Africa
  • OEM Sales volume and market share
  • Car segment Analysis
  • Industry Drivers/Factors and Opportunities
  • Vehicle Price point
  • Purchase behavior Analysis – Digital and conventional
  • Top Models of each segment and OEMs
  • Product life cycle analysis
  • Customer mapping
  • New product launch strategy
  • Income level and car buying relation
  • Kep specs and features
  • Brand Perception of brands/OEMs
  • Country Analysis
  • Regulations Analysis
  • Passenger Car Product Strategy and position
  • Segment-wise Competitive Landscape
  • Key Macro Economy Analysis and Forecast

ACG Databank released the latest data on Indian commercial vehicle Model-level Sales forecast.

Following are the key highlights of the data:

  • Existing, new launches, and coming of Vehicle models
  • Model wise sales and Production data from 2013 to 2023
  • Data from 1T to 49+ GVW
  • Model Name, GVW, Brand Name, Engine Model name, Engine power & Torque, Bus Height, Running cycle, Price, Product USP, Key features,  Transmission Detail,
  • Mini Truck, Pick up Truck, Tipper, Tractor, Rigid Haulage, School Bus, Staff Bus, Tourist, STU, Private, Intercity, Intracity and so on
  • SCV, LCV, MCV, and HCV
  • Top Models of each segment
  • Sales volume trend and forecast show the market trend information
  • The market size in terms of value (in USD)
  • OEMs included Tata Motors, Eicher, Ashok Leyland, Volvo, Scania, BYD, Corona, Force Motors, Mahindra, Bharatbenz, JBM, and Piaggio
  • Customer type
  • Application/uses

Indian Bus Truck and Bus Model wise Sales and Production data and Forecast

The database is useful for

  • Product and Business planning
  • Competitor Analysis
  • Segment Trend
  • Data mapping with sales, and technical specs
  • The product portfolio for Electric vehicles

We also have a Global Commercial Vehicle Model wise Production data

The perception about the car Industry of India is that it is dominated by the small and low-price car segment. The latest study by ACG clearly indicated that this trend has been slowly changing in recent times as can be seen from the last five years of time.

The share of the small car segment in the Indian car market lost about nine percent between CY 2014 to CY HY 2019. The share of the segment of the MUV came down to 10 percent from the previous 13 percent from CY 2014 to HY CY 2019. The Hatchback car segment is almost fixed at its place, whereas the Sedan car segment lost about 8 percent in the duration of last 5 and half years of time.

ACG categorizes the overall Indian car industry into five categories namely – low price, value plus that is the budget category, premium, luxury, and high-end cars depending on some of the specific parameters that are considered by customers segment.

The segment categorized as low-price moved into the value plus segment. The share of the low-price segment in the Indian car market came down to about to 13 percent in CY HY 2019 from 19 percent in CY HY 2014, thereby showing a decline of 6 percent. On the other hand, the segment of value plus increased from 66 percent to 71 percent in the same period of time.

Simply get hold of our monthly subscription which necessarily provides the key insight of the overall Indian car market movement along with the forecast.

The Key Highlights of the Report:

  • The Indian Car Industry Market size in volume and in Value (USD or INR)
  • Segment-wise Market forecast
  • Key Models performance and map with the market dynamics
  • Most effective advertising strategy
  • The segment share trend Analysis
  • How the customer changes their preferences with income, and availability of a new product range
  • Check the customer pulse before buying the car
  • How brand perception change with the time
  • OEM/Brand & Model wise Sales and Market Share Analysis
  • Model wise Product life cycle and Sales Volume relationship
  • OEM wise Sales Strategy Analysis and it’s an impact
  • Target customer analysis
  • Brand relevance study – Brand wise

The Rise of Tata Motors Even After Losing Track is our detail report. The car market of India is necessarily become quite a competitive day by day. This can be clearly proved from the rise of Tata Motors even after it lost track between the years 2012 to 2014. In the year 2012, Tata Motors was in a commanding position in certain segments in the Indian car market with about 16 percent share of the market. In between the years 2012 to 2014, Tata Motors lost its grip in the segment of passenger vehicle and slipped down to about 5 percent market share from the commanding 16 percent. Some of the major reasons for the downfall so cited in this regard are poor product portfolio, changes in brand perception, and competitor position. These were some of the key reasons as to why the sales of Tata Motors went down in that period of time.

Tata Motors Car and SUV and Model level Market Share Analysis

With the launch of Tiago from Tata Motors in the year 2016, the company started to regain its lost reputation once again which marked the rise of Tata Motors even after is lost track for quite some time. The pricing, product specifications, and outstanding features were integrated into the car so as to target Indian middle-class buyers who would be using the vehicle for personal use and not for a taxi. Before this, a lot of Tata cars were predominantly going to taxi segments. Now, in spite of that, the same is not happening as Tata Motors have simply outperformed the market since the year 2016.

Most importantly, Tata Motors made a very smart move by promoting Tata Tiago and attracting the attention of the buyers by taking the football icon Lionel Messi. Tata Motors set an excellent example of how to change customer perception by changing its brand position by launching a new product range. Still, now, there is a very big opportunity for the company to increase the share of its market from seven to a whopping fifteen percent in the next three years of time.

Tata Motors Business Strategy

The product life cycle which is more popularly referred to as the PLC is the key behind the success of Tata Motors in the segment of the car as well as SUV. The top four models of the company are in the phase which is known as the ‘Growth in Product life cycle’.

The ‘Value Plus or Budget’ segment is the largest segment in the overall Indian car segment as per the ACG definition. The segment share of Tata Motors in ‘Value Plus’ segment is about 81 percent in CY 2018 within the Tata PV segment. Tata Motors as a company is still not present in a number of segments as well as sub-segments.

Tata Motors Product Strategy

ACG made an analysis of the success factor behind each and every model necessarily had its own USP. For example, the Harrier design is the first feature of the vehicle to take a call to find out more about the vehicle.

Harrier is in the premier SUV segment for the buyer who wants to upgrade their SUVs or cars. Brand loyalty and customer advocacy also play quite a vital role in the enhancement of its sales and performance. This is certainly going to be game-changer for the company. The company, Tata Motors has quite successfully changed its product image which is undoubtedly a great improvement from the perspective of the brand.

Most importantly, the dealers are also cracking deal with the aggressive strategy thereby enhancing the brand image of Tata Motors once again after it had lost track between the years 2012 to 2014. So, we have to just wait and watch what Tata Motors exactly does in the time to come.

Key Highlights of the Report:

  • Indian Car (PV) market size and Forecast
  • Tata Motors Sales and Market Share assessment study
  • Segment and Sub Segment Analysis
  • Tata Motors Product Portfolio and competitor Analysis
  • Car, SUV, and MUV product strategy
  • Product Price, Discount, Exchange schemes, Features, and Specs
  • Customer segment Analysis
  • Dealer performance
  • Challenges and Opportunities
  • GAP Analysis
  • Brand Image, Position, and Perception
  • Buying Journey of Tata Motors existing and Potential consumers
  • Marketing Strategy of Tata Motors
  • Advertising Analysis and its impact
  • How the company created value for its customers

At present, the Indian Car Industry is experiencing a headwind and showing a high level of degrowth. The new product launches are trying their best to support the boosting up of the sales and help in the establishment of positive sentiments in the overall car market.

In the past six months, XUV 300, MG Hector, Hyundai Venue, Seltos, Kicks, i10 NIOS, and Harrier are launched in India for the purpose of pushing up the sales to some extent. Renault also has launched the Triber which is basically a compact multi-purpose vehicle that comes at a starting price of Rs 0.48 million near about two years after the launch of Captur SUV in the year 2017.

Indian Car SUV and MUV segment Analysis

On the other hand, the Indian SUV market has doubled its size in the last five years of time and it is growing continuously. Triber from Renault is actually targeting the car market of the category of 1.0L engine. This is the market that is showing continuous degrowth of 1 % every year since the CY 2014 and it is about 17 % of the total car market size in India. This particular segment is shifting from 1.0 L engine to 1.2 L engine car segment which has shown a growth from about 31 % in the year 2014 to about 44 % of the market share of the overall car industry in the CY 2018.

1.0 Litre engine car suv and MUV market size and share

At present, Renault occupies almost about 3% of the total car market. Now, if the Renault launches one more variant of Triber with 1.2L engine, it will presence in about 43 % market share and this market size is more than double the present market size occupancy of Triber.

1.0 to 1.2litre engine Indian car market size and market share

The Triber comes in four different variants. The RXL is priced at Rs 0.54 million, RXT at Rs 0.59 million and top-end RXZ at Rs 0.64 million. The high-end variant of Triber could fall in the category of 1.2L engine. If we consider this segment based on ACG definition of the car segment, still then its present position would be falling under the ‘low cost’ segment which is squeezing every year and the category of 1.2L comes under the ‘budget segment’ as per ACG definition which is continuously growing every year.

Renault Triber Product Strategy

Triber likely to satisfy most of the top criteria of car purchasers for first-time buyers in India. Multi-purpose uses cars with more space are rated as the top criteria in buying decision in India. Better brand perception also plays important role to select the vehicle.

Buying behavior survey of car customers in India

The customers readily prefer the vehicles that have a much better pick up and they are even ready to spend 0.1 million more for a better performance as well as driving experience. The customers will actually have more confidence that the vehicle would be able to carry people easily and conveniently.

Key highlights of the report:

  • The market size of the Indian car Industry
  • Renault Product, Marketing, Sales, and Brand Strategy
  • Product life cycle
  • Brand Perception
  • Segment-wise Sales and Market share
  • Price-wise Renault Market assessment
  • Dealer network
  • Product planning
  • Advertising Strategy – TVC, Print, Digital, and another medium
  • Customer experience and expectations
  • Customer engagement
  • Key Competitors Analysis
  • Upcoming new product
  • Technology Analysis

We have released Indian Automobile Industry Report Q1 FY 2020 report. India has become an established ground space for the automotive companies for their growth and development and we are swiftly narrowing our gap over several established locations around the globe.

In the first quarter of the financial year 2019-20, there was a huge decline in the car sales rate which can be accounted to be 23 percent, while passenger vehicle sale rate has nosedived to a mere 18 percent. This is considered to be the worst quarterly performance since the third quarter of the year 2000-01. In the year 2000-2001 the car sale rate graph came down by 27 percent and the passenger vehicle sale rate also declined by 23 percent. This decline in sale rate brought immense financial as well as economic loss to many automotive companies.

The Indian automobile industry has started to show a deep decline in the market after a near-decade of attractive growth. However, the fundamental of the automotive industry is still strong. India is slowly but steadily emerging as the powerhouse in the automobile industry but there are still many factors which pull the string from making our country move ahead.

There are many factors which contribute to this decline the factors can be listed as below:

  • Lack of consumer spending power
  • Poor monsoon, and Flood situation
  • Maintenance and purchase costs increase
  • Lack of promotion of electric vehicle by introducing new guideline and schemes
  • Distress in rural markets
  • Tight liquidity and BS-VI norms

The above-mentioned factors have made an immense impact on industry growth. All the major OEMs have started to upgrade most of their product line to meet the new BS-VI emission norms and this will bring cost pressure on OEMs. Many Automotive dealerships have already closed their shop due to poor sales in the past and many companies are facing the hurdle to meet the sale target. This will also have a huge impact on the new hiring and new expansion plan.

Indian Automotive Sales Production and Export Analysis Q1 FY 2020

In the current scenario, the worst-hit segment is the passenger car segment that shot down by 24 percent. The passenger car segment declined by 23 percent, SUV/MUV 5 percent and Van 26 percent, for the commercial vehicles segment the decline rate was 10 percent whereas for the three-wheeler sector the decline is considered to be 7 percent. In the motorcycles segment, the decline rate is about 9 percent, whereas for the scooters segment the sale rate reduced by 17 percent and for the two-wheeler segment, the decline in sale rate was calculated as 12 percent. The Overall decline in the sale rate for automobile sales in the country is considered to be 12 percent for the month.

Indian Automotive Market Analysis Q1 FY 2020

India is considered to be a sleeping giant in the automotive market. In the current living trend, 18 out of 1,000 Indians own a car when compared to the citizens of the United States where nearly 800 out of 1000 and the in the other European Union around 500 out of 1000 own a car.

The decline in the industry is due to the lack of facilities to maintain and run a vehicle, the cost and amount required today to expense, the lack of development of infrastructure and finally space and time to run a vehicle and reach the destination in time. When these hurdles are crossed we can India leaving behind the other automotive giants across the globe in no time.

Passenger vehicle segment has shown a decline 18 percent in the first quarter of FY 2020. The commercial vehicles sale rate in the domestic market were down by 10 percent when accounted there was a sale of around 2,08,298 units in the Q1 FY 2020 this year, as compared to 2,30,236 units in the year-ago Q1.

Indian Passenger Vehicle Market Analysis Q1 FY 2020

The major car manufacturers like the Maruti Suzuki, Hyundai, Tata Motors, Honda, and Toyota have reported a decline in the sale rate for the Q1 FY 2020. Nissan has registered 50 percent de-growth.

Indian Commercial Vehicle Market Analysis Q1 FY 2020

The Commercial vehicle segment sales experienced a 10 percent decline in Q1 FY 2020 when compared to the sale rate same period a year ago. Tata Motors, Ashok Leyland, Mahindra, and Eicher reported a decline in sales of products due to poor demand among the consumers.

Indian Truck Market Analysis Q1 FY 2020

The Indian Truck Industry is also going through a tough phase. The multiple market dynamics are applying the brake on the truck sales. The sale rate of all major the players have slumped in Q1 FY 2020 when compared to Q1 FY 2019. The fleet owners are not showing any interest in immediate purchase of the truck due to low utilization of truck carrying capacity and falling freight rates after implementation of new axle norms.

Indian Bus Market Analysis Q1 FY 2020

Indian Bus Industry has shown a 2 percent decline in the growth rate in Q1 FY 2020. The Two major players of the truck industry Tata Motors and Ashok Leyland have reported single-digit growth in Q1 FY 2020. Tata Motors was able to increase its market share from 33 to 36 percent whereas Ashok Leyland added were able to increase its growth rate only by 1 percent, unfortunately, Eicher lost 2 percent of its market share.

Indian Two Wheeler Market Analysis Q1 FY 2020

The Two-Wheeler segment reported 12 percent de-growth in Q1 FY 2020. Hero Motor, Honda, TVS, Royal Enfield, Yamaha, Piaggio. Mahindra, Triumph all the major OEMs and companies witnessed a decline in their sales. Honda market share slipped from 30 to 27 percent in Q1 FY 2020. Bajaj Auto is in good condition.

In the current budget, Govt has proposed of raising the duties on automotive parts and additional special excise duty of 1 INR per liter and road and infrastructure cess of 1 INR per liter on both petrol and diesel fuel. This increase in the fuel cess price and excise duty will drag the current scenario to the worst situation. It is evident from our research of the last ten years that increase in fuel prices impact auto sales far more than other factors.

The firms have to initiate a thought process and framework to have a better chance of finding the solution for the decline and develop a base ground for an improved sale rate. Those companies or firms who are not able to find a method or solution for success will find it difficult to keep a hold in the market. And those who have made business strategies on a strong base will stand a much greater chance of meeting a success.

Take our subscription services for Monthly Analysis

The highlight of the Indian Automobile Industry Analysis Report Q1 FY 2020:

  • Indian Automotive Sales, Production, and Export analysis
  • Key finding
  • Top reseason behind the current situation
  • Forecast for the next 3 quarter
  • Segment and Sub-segment analysis
  • OEMs Market share movement
  • Growth analysis
  • New Product Launch Strategy
  • Segment covers – Car, SUV, MUV, Van, Commercial Vehicle, Truck, Bus, Two Wheeler, Motorcycle, Scooter, and Three Wheeler

Electric Bus Product Planning data is a critical data set which especially prepares for Electric Bus product planning and product portfolio. ACG plays a key role in creating the Electric Bus product portfolio India. The data is useful for all bus segments and applications.

Key highlights of the Electric Bus Product Planning and Strategy:

  • City & State wise Bus volume trend and Forecast
  • Per day running (Duty Cycle)
  • Model Name and mapping volume and specs to city data
  • Customer type
  • Acceleration
  • Top Speed
  • Bus Application – Intercity, Intracity, School Bus, Staff, STU, Private, Special Application, and others
  • Front or Rear engine
  • AC/Non AC
  • Bus length
  • Vehicle weight (GVW)
  • Floor height
  • Fuel type
  • Seating capacity
  • Price
  • Type CWC or Fully built
  • OEMs included – Tata, Eicher, Ashok Leyland, Volvo, Isuzu, SML, Scania, BharatBenz, Mahindra, BYD, Corona, JBM, and Force

Electric and Hybrid Car Market Analysis is our exclusive report. In the current trend, there is a general view regarding the electric vehicle that these models of vehicles are becoming very relevant in the global context. But in a pragmatic manner, India is a long way off from seeing any wide-spread adoption of electric vehicles. This might be true regarding the passenger car segment where most of the global focus is concentrated. There is a certain belief among the consumer that all other vehicle segments will see the electric vehicle to be adopted in a much faster manner than expected. The economics regarding the electric vehicles is working out to be far better than the internal combustion engines and that too even without any incentives.

We expect the diffusion of electric vehicles into the market will increase significantly in the next few years. The benefit of owning an electric vehicle compared to an internal combustion engine vehicle is increasing significantly. ACG forecast that the Indian electric car market will have an improved market share of 30 to 35 percent in the passenger vehicle segment. The Indian electric car market is expected to reach a sale rate of USD 11.8 billion by the year 2030. The electric car industry is expected to register 87 percent CAGR from the year 2019 to the year 2030.

There are development and innovation in every step of vehicle segment development. The hydrogen fuel cell car is the next technology that has been developed and which will replace the BEV in the coming years. The hydrogen fuel cell technology is having many advantages when compared to BEV. The competitiveness and market establishment of hydrogen fuel cell cars will totally depend on fuel cell costs and refueling stations.

Indian-Electric-Car-Strategy-Report

In the case of BEV, there are 4 stages to reach 30 percent of electric car volume by the year 2030. The stages are mentioned below:

  • How to create demand
  • Make a supply chain network in India
  • Produce cars and export to other countries and expand the market

Maharashtra, Gujarat, and Delhi are the top states for electric car implementation; it contributes around 45% sales volume.

Chinese OEM’s are targeting the electric vehicle segment due to their experience with electric vehicle technology. The available product portfolio and consumer purchase behavior will depend on the product and it will change based on the electric car. In the year 2008, the segment share of an electric car was a mere 0.02% and it touched only 0.4% in the year 2019.

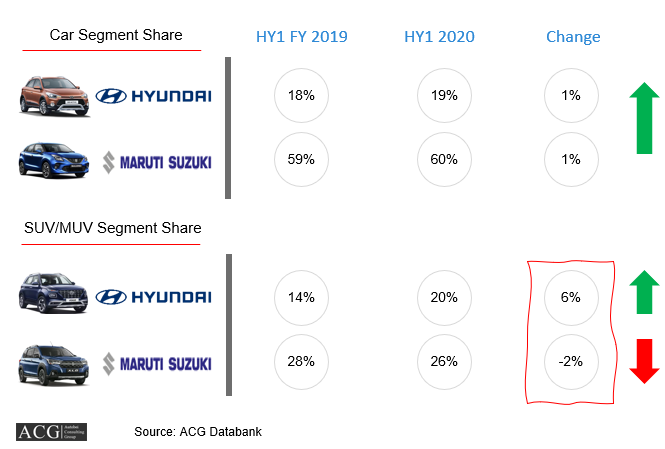
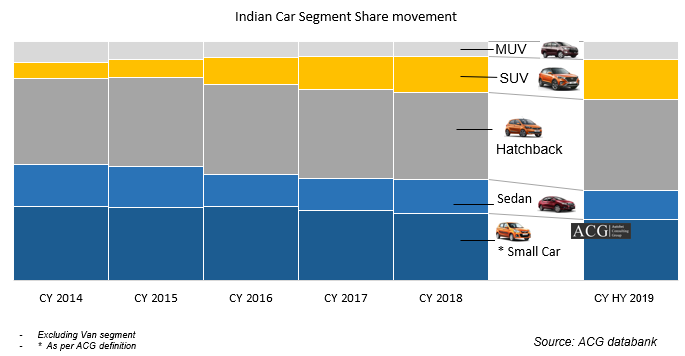
The Indian car market size is more than 3.2 million and it is mainly dominated by small and sedan car segments where the price range of the cars is between three to ten lakhs depending totally on the product. The Indian per capita car is at a ratio of .02(20:1000).

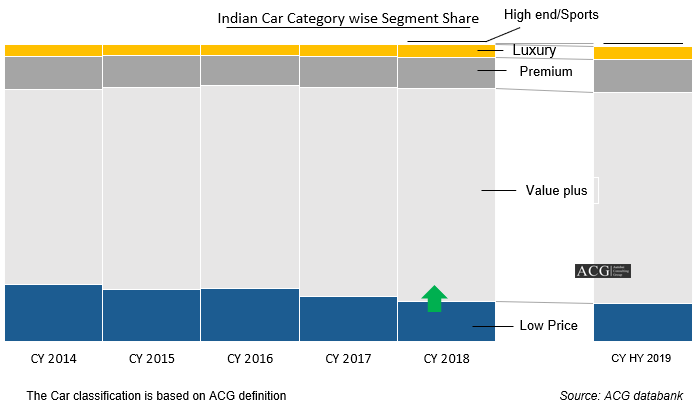
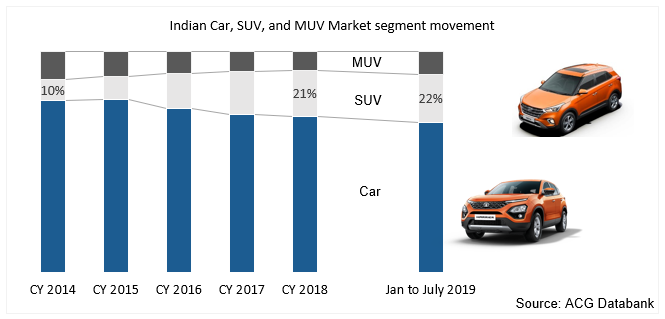
On the basis of the product, the Indian electric car market has been classified into different segments such as hatchback, sedan, SUV, MUV, van, sports car segment, luxury, mini, micro, and other models. The majority of the passenger cars which are sold in India belong to the small or mid-size segment.

The electric car is just not a product or mobility solution. It is considered as the combination of technology, social responsibility, style, and experience.

Depending on the technology, the Indian electric car market has been categorized into battery electric vehicle (BEV), Plug-in hybrid electric vehicle (PHEV), and hybrid electric vehicle (HEV) which is again divided into mild and strong hybrid models.

Out of the three categories (battery electric vehicle (BEV), Plug-in hybrid electric vehicle (PHEV), and hybrid electric vehicle (HEV), the BEV category dominated the market during the historical years and is expected to continue doing so in the coming years. Much of this domination in the market can be attributed to the highest subsidies offered by the Indian government on the purchase of battery electric vehicles as compared to PHVE and HEV models.

The limited mileage logged which is considered to be 30 to 50 KMS per day, by the PVS category vehicles electric vehicles are considered useless even for eight years of the ownership period. In case the battery cost comes down to 60 USD/KWH the above-mentioned statement will hold true.

The major factor to consider is to understand the consumer’s need, outlook, and concerns regarding the product as to why the growth of the market for electric vehicles has been slow. In the upcoming sections, we will detail the reasons stating the drawbacks in the current trends and products concerning electric vehicles when compared to conventional vehicles.

The change in economics will be driven by a few factors such as

  • Price of the battery
  • Economies regarding the scale for electric vehicles
  • Charging station at locations
  • Range of travel in a single charge
  • Availability of battery of product life cycle
  • After-sales support and resale value of the vehicle.

Price of the Battery:

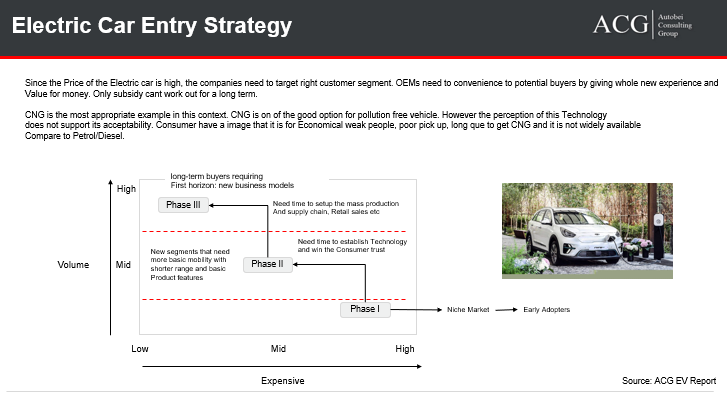
This industry is price sensitive at the upfront and operating costs. The single major factor for slow penetration of electric vehicles is the high price of the product which is around 2 to 2.5 times more when compared to the conventional vehicle. The operating cost which will include the running, as well as the maintenance cost, could be as low as 1/4th of that of a conventional vehicle. The price of the electric car segment is expected to reduce in the upcoming ten years.

In the case of the personal transport segment the cost dynamics will not work out as profit periods for the products will currently exceed a time period of five years. There is a feeling that the profit period has to be less than three years for a transition to happen smoothly and efficiently. This transition will happen by the year 2021. The transition will happen smoothly depending on the factors such as battery prices get lower and internal combustion engine cost gets higher post-BS-VI.

On cars, market infiltration will be driven totally by the type of fleet segment where electric vehicles already make sense based on the type and geographical requirement. The vehicles fleets will have to spend on their own charging network. As such this dependency on technology development and requirements will limit the market infiltration of electric vehicles to less than 10 percent of the total PV volumes even by the year 2025.

Range:

The other important concern regarding electric vehicles is their range per charge. To offer a higher range the higher battery capacity in the vehicle is needed which will lead to an increase in the electric vehicle price which will be roughly proportionately to the battery capacity and this increases the price gap of the product.

Product portfolio:

In the current trends, there are limited numbers of electric vehicle models available in the market which can be counted on a finger. In the ICE segment, the consumer has more than thirty models in each segment with a minimum of three variants in each segment. In the case of an electric car, there is no option to choose different products. The consumer also cannot choose different types of battery based on the requirements it will be prefixed based on the model.

Charging infrastructure:

The consumer needs a fast-charging infrastructure every 10 km distance. This is one of the major issues to take off the electric car sales. Most of the stakeholders ask or think that it is the question of “egg” or “hen”. It cannot be considered as an egg or hen. There must be charging infrastructure installed at a different location before selling the electric vehicle to meet the count.

Today the Indian market is having around 400 charging points. The country needs more than 4 lakhs of charging point stations to meet the requirement. So there is a big gap between demand and availability. Out of the total number of charging points across the country, only 50 are fast charging points.

Around 70 to 80 percent of the cars are parked on the road. In this case, only charging points are not enough to meet the consumer requirement. The consumer will need a longer cable to charge the vehicle, which is not viable, even in case of the rainy season it would be difficult to charge the vehicle. This can be a drawback for the product sale.

The govt or private investors or OEM will have to first build the charging infrastructure. ACG has done detail cost and ROI analysis of the charging station. The charging station cannot build be hand to hand. In the ACG survey, 55 percent of the consumers expect to have a charging station at or near to their home and 25 percent at a public charging station. The consumer does not want to be part of the trial process. They want some concrete solution instead of being a part of the trial and error method. This also cannot be compared with mobile tower development since there was no other mobile technology existing during the initial stages. It was a step by step process first and then improve slowly since the consumer did not have the second choice.

In the case of the electric vehicle segment, the scenario is different. There are more than 200 years old tested and trusted ICE technology that still exists. Replacing this ICE technology is a difficult task with new electric vehicle technology. To replace the ICE technology, OEMs will have to offer a not different product but a much better product and technically high-level products. There are mainly 3 types of charging station:

  • Slow charger,
  • Medium charger, and
  • Fast charger.

When compared to the personal vehicle segment the commercial vehicles like taxi fleets, bus fleets, three-wheelers are capable to run five times more the distance throughout the day. Due to the higher mileage levels, the initial cost, as well as the operating cost, will be higher when compared to the low mileage vehicles. For the higher mileage vehicles, the profit returns will be slow and less when compared to the low mileage vehicles.

As per the ACG survey in 20 cities (2000 sample size), most of the personal vehicle buyers consider the initial purchase price, fuel efficiency, maintenance and service cost, comfort features as the major buying criteria. The commercial vehicle buyers will take into consideration the CAPEX along with the OPEX cost economics as the most important purchase factor.

Automotive component suppliers:

The introduction of e vehicle has put the auto components manufacturer companies to face serious survival issues if they are not ready for this transition. The companies like BOSCH and Mothersun Summy have already started solving the issues and trying to save their place in this market dynamics. There will be a high thread to lose employment.

The unorganized sector is also having a strong presence in this segment. They will also face a difficult situation due to the transition. From the last 5 years, this industry showed around 10 percent CAGR. Radiator, oil filters, engine, and transmission manufacturers will also face a survival issue due to the change in the trends. On the other hand, companies like software development, hardware providers, electronics will get reap enough benefits.

The traditional component manufacturers will have to expand or change their product hand-outs by collaborating with makers of the electric vehicles. This collaboration will act as leverage for their technological expertise. To develop specialized parts for the hybrid as well as the electric vehicle for domestic and export markets this tie-up will act as a catalyst for growth and development as well as expansion. India has a relatively strong base for electrical and electronic components of automobiles. This market can be used as a leverage to tap into the currently trending and upcoming electric vehicle sector.

The government schemes and subsidies are the major driving factors for the growth of the electric car market in India. Central and state governments are encouraging the increase of electric car sales by introducing several schemes. The government has made some changes in FAME II compared to FAME I. One of the major change is that mild hybrid will not get any subsidy. This segment was having the largest share in getting subsidy under the FAME I scheme. In the car segment, the private vehicle owner will not get any subsidy.

The urban population has increased rapidly over the past decade, resulting in rising in pollution levels. The introduction of electric vehicles will see a decline in pollution levels.
India electric car market competitive landscape

There is no competition in the electric car segment. The only major player in the current market is Mahindra electric mobility. Tata is the second player in this segment with an E Tagor car. Volvo is entering the PHEV SUV segment. More competition and competitors will enhance the product levels which will help attract more consumers.
Hydrogen production

The fossil fuels, biomass, water, or a mixture of both compounds will help extract hydrogen gas. The natural gas is currently the major source of hydrogen production. The natural gas extraction is will account for a share of three-quarters of the annual global dedicated hydrogen production which will quantities around 70 million tonnes of hydrogen. This 70 million tonnes of hydrogen produced from natural gas will account for 6 percent of the global natural gas use. The natural gas consumption is followed by the use of coal, due to its overriding role in China, and a small fraction of energy is produced from the use of oil and electricity.

The technical and economic factors will play a major role in the production cost of hydrogen. The gas prices and capital expenditures are considered to be the two most deciding factors of the price range.

The fuel cost is considered to be the major cost component which will account for between 45 to 75 percent of the production costs. The low gas prices in the Middle East, Russia, and North America give will give rise to some of the low-cost hydrogen production. This low-cost production will act as leverage for development in the upcoming stages. Due to the higher hydrogen production costs, the gas importers like Japan, Korea, China, and India have to struggle with higher gas import prices that can backfire the development plans.

The deteriorating costs for renewable electricity such as solar power, wind power the interest is mounting in electrolytic hydrogen. There have been several demonstration projects in recent years regarding the use and development of electrolytic hydrogen.

Innovation will always come at a cost. In the case the cost is innovation when coupled with proper Technology will devise a solution for better result. This result will help us shape a better tomorrow.

Highlights of the report:

  • Electric and Hybrid car Introduction
  • Global Electric car Introduction
  • Indian Electric Car market Introduction
  • Current and future demand for Electric car
  • Electric Car Product Analysis, Product portfolio, Upcoming new product, and
  • Product position
  • Customer segment and mapping their needs/wants
  • Battery Introduction and Analysis
  • Charging infrastructure availability and requirement analysis
  • Setup cost and a Business case of charging station
  • Key challenges
  • Energy Demand Analysis
  • After-sales analysis
  • Expected business models
  • Govt incentive, regulations, and policies analysis along with their impact
  • FAME I and FAME II