The U.S. car market is one of the largest in the world. Almost all global brands have a presence in this developed economy and mature market.
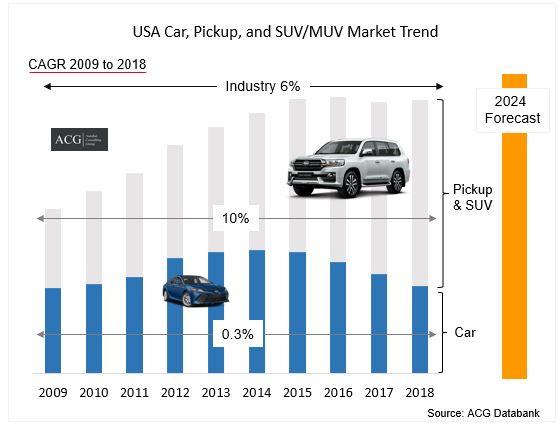
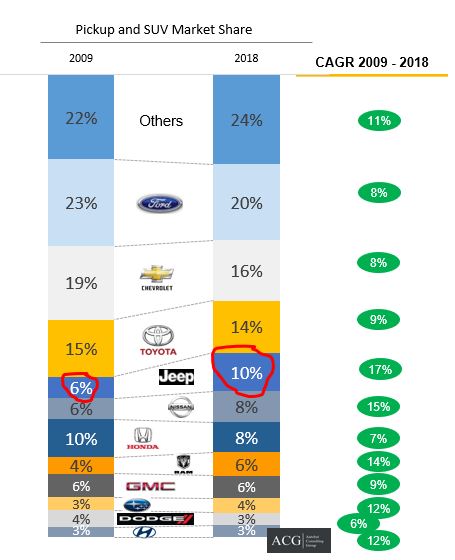
The overall size of the car, SUV, MUV, and Pickup market was about 17.2 million units in 2018. Ford, FCA USA, and GM Pickup/SUV had a combined market share of 59 % in 2009, which slipped to about 54 % in 2018. The forecast for the car segment for the year 2019 is not quite certain. However, ACG forecasts that the car segment will end 2019 with single-digit degrowth.
Segment-wise Market Forecast:
Safety and comfort for the family are the key reasons for the adoption of the MUV vehicles, multiple purpose suitability of Pickup truck, and lifestyle. In the next five years, MUV will certainly be the first choice of major customer groups. The average distance covered by the Americans is about 14,000 miles per year, as mentioned by the U.S. Department of Transport. This is one of the major reasons as to why Americans prefer bigger vehicles. 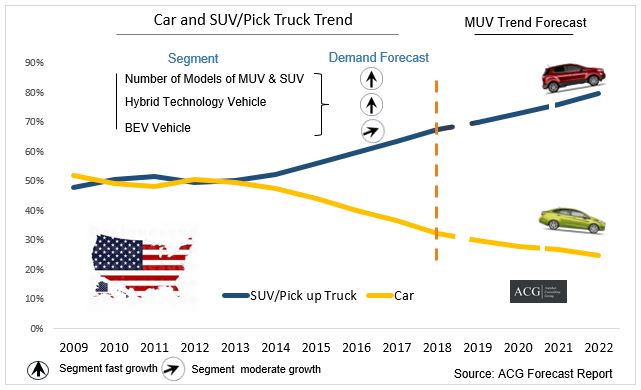
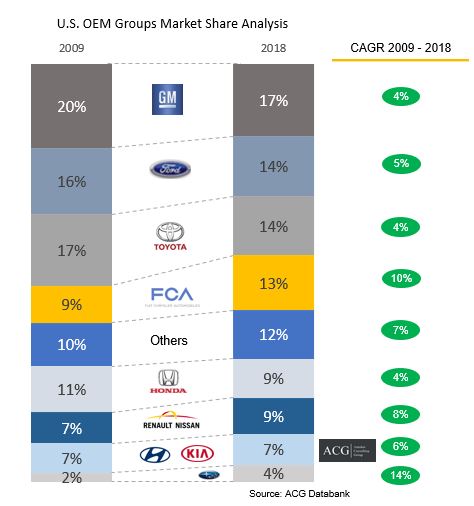
GM, Ford, and Toyota are the top 3 OEMs Group in the U.S. :
It looks that Detroit is in the grip of a car recession that is marked by the collapse in the demand of traditional sedans, other types of car bodies which accounted for 52% of the market about 10 years ago. The buyers have made a mass exodus out of the classic family cars, and into the sport utility vehicles or the SUVs. The top-selling car models like the Honda Accord and the Ford Fusion marked a record low of more than 25% of the total sales in the United States in the year 2018, and things will only get worse. The customer experienced that they are getting a better value proposition in MUV vehicle irrespective of the price tag.
Industry Trend Analysis:
We have carefully examined the influence of the vehicle attributes, brand loyalty, Product portfolio, product line characteristics, emotions, as well as dealerships. We have found that nearly all of the loss in market share for U.S. manufacturers can be explained by the changes in basic attributes of the vehicles such as price, size, power, operating cost, resale value, reliability, transmission type, and body type. The US manufacturers have improved the attributes of their vehicles but not as much as compared to the Japanese and European manufacturers which are exactly why the result.
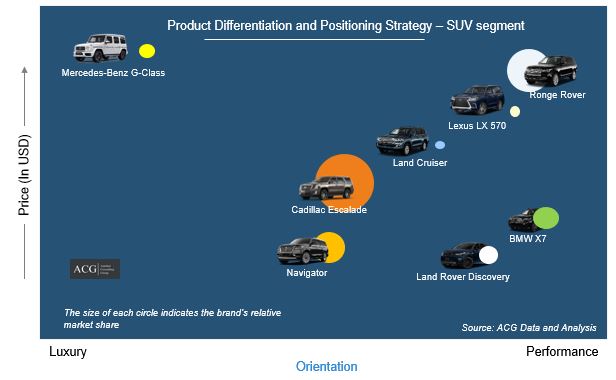
The Japanese automakers are manufacturing light trucks in the United States for the avoidance of tariff and the introduction of the minivans, SUVs, and pickups, while the European premium OEMs are entering into SUV segment also.
GM, Ford, and Toyota, Honda are all losing their market share in the last 10 years in the Pickup and SUV segment. By launching new models and offers, Nissan and FCA USA are increasing their market share of the light truck/SUV segment.
Rate of unemployment, the sentiment of consumer, disposable income, and availability of credit are the positive key supportive indicators of the U.S. Auto market. The recent data clearly shows that the car industry is going to down by about 1 to 2 % in the year 2019. The overhang of tariff wars, as well as the buying pattern move for the used cars, has some impact on this downfall, but it is not the key reason.
ACG analyzed what is the impact of new technologies like driverless vehicles as well as the preferences of millennial and Gen Z consumers, new regulations which are the contributors in the driving of the future demand.
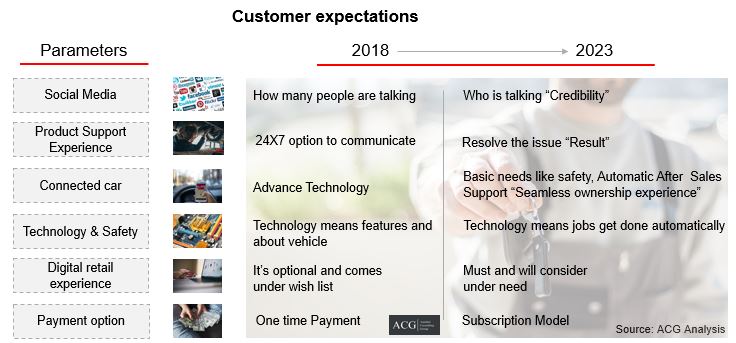
Now, the point to stress is to what are the factors that are influencing the U.S. car industry. ACG developed a completely new research model that combines macro-level qualitative as well as quantitative factors. Now, for seeing the broader and macro-level picture, we have considered several other factors such as customer expectation, changes in their needs and their wants. The customers, technology as well as the Industry structure are changing at a rapid pace which are also to be kept in mind. The auto industry of the U.S. is also going through disruption and it is essential to redefine the mobility frame.
There are some customers who also prefer to buy the used vehicle or simply take it on lease or rental. The United States of America is having multiple ethnics in the country with several Asian and American origin people. Each of them follows different criteria for buying the vehicle. Asian people prefer Japanese vehicles whereas, on the other hand, the American people prefer the Pickup and SUV of American origin of the U.S. like FCA USA, GM, and Ford.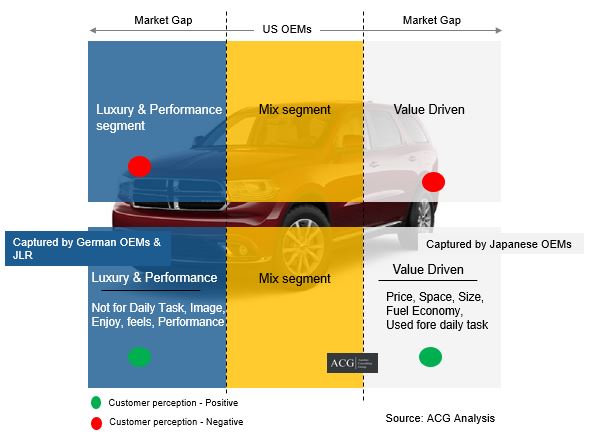
In the year 2009, the car segment was having about 52 % segment share which has come down to about 32 %. SUV, MUV and the Pickup segment had about 48 % segment share which gained about 20 % market share in the year 2018. The choices of the customers are shifting towards SUV and the Pickup segment slowly. We spent a lot of time among customers in the U.S. for a clear understanding of their pulse for knowing the exact reasons behind this shifting trend. The customers themselves became advocate to recommend other customers to go for the SUV/MUV/Pickup vehicles.
Now, there is the new trend of the expectation of the customers that are required to be added in customer preference that is the introduction of new technology such as connected vehicles, great digital experience, and autonomous vehicles. The OEMs should make it a point to add these features in their product portfolio. These features not only attract new customers but also plays a vital role in helping the brand to shine and position appropriately.
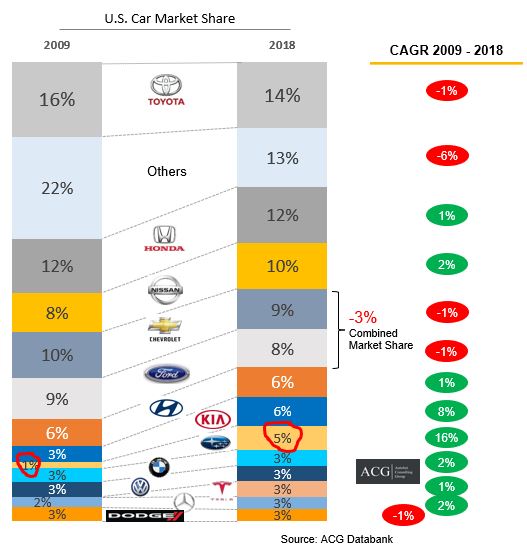
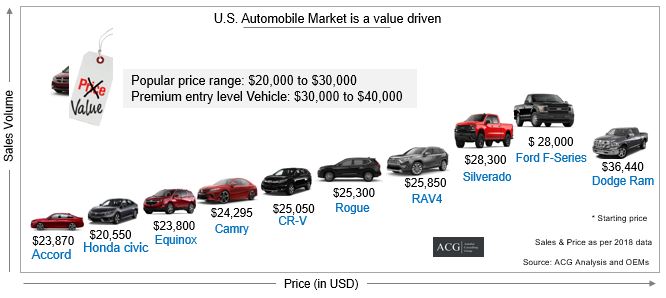
The car market of the United States is a classic example of where “Value” is more important that “Price tag”. The top ten vehicles of the market are having inversely proportional relation with the volume of sales with some minor exceptions.
The buying of the new car is probably the next big investment after real estate. So, people give a lot of preference for value and not price. The vehicle here is not only the technical subject but also the emotional aspect as well since most of the customers associate emotions with the same as well.
The car market of the United States is in transition state and OEMs, suppliers, as well as other stakeholders, need to have a clear understanding of the pulse of market movement. This, in turn, is quite helpful to create business strategies for the next ten years. In the next ten years, the U.S. automotive industry will get a new shape.
Customer Perception and The Customer of The Future:
Japanese and Korean automakers have developed a perception for the manufacturing of affordable cars with a value pricing strategy that comes with the latest technology, advanced features, reliable performance, and striking exterior and appealing interior with competitive prices. Premium car but at affordable price. The automakers of the United States may have lost the market share because of the low-value proposition of their cars and brand loyalty of the customers towards the Japanese and European automakers.
ACG did not conduct any survey but discussed with the customer to read between the lines and get the pulse of the customers. Most of the U.S. customers are ready to adopt autonomous vehicles if they are convinced that these autonomous vehicles technology is safe and secure enough for operating on their own.
Tesla, on the other hand, registered excellent growth. It added 2 % thereby an increase from 3 % to 5% market share in the year 2018 that is in just one year. The reason behind this growth was due to its customer attraction of electric technology, screen display and a number of other good features whereas the other OEMs were not offering such features by that point of time in 2018. After the year 2018, all the other OEMs also started to offer most of those features in their vehicles and as a result of which the charm for the Tesla vehicles became weaker as per the study conducted by ACG.
As per the ACG customer survey, more than about 80 % of the younger millennials cite technology and infotainment features as the ‘must-haves’ at the time of purchasing a car while on the other hand, 61 % of car buyers use video for research. The key to a successful car marketing campaign is creativity for tugging on the heartstrings of the customer and be memorable.
Brand Strategy:
It is essential for the OEMs to create the future of a car brand that has several unique & different attributes rather than the traditional attributes. The OEMs that have a stronghold in software & hardware technology, Understanding Customer needs, deliver a simple solution of a complex issue, and Personalized communication will be considering the key attributes for the definition of a car brand.
Saying 50- or 100-years legacy will not be a catchy word in this regard. Brand loyalty is inextricably related to developing, maintaining, as well as protecting the market share. Mannering and Winston (1991) found that a significant fraction of GM’s loss in market share during the 1980s could certainly be explained by the stronger brand loyalty which the American customers developed toward Japanese vehicles as compared with the loyalty that they had for American vehicles.
Product strategy:
The OEMs need to create the product strategy in three phases
- Short term
- Medium-term, and
- Long term strategy
Every section has its own impact on its market share and creates a base of loyal customers. The most basic attributes of new vehicles such as price, size, power, operating cost, reliability transmission type and the type of body are changing and they influence the purchase decision.
Economic theory suggests that the product line rivalry might be an important feature of competition in the market of the passenger vehicle. This is because the customers have very strongly varying preferences. These preferences can be met with a shorter product life. ACG analysts stress the fact that it is of immense importance for the automakers to develop attractive product lines that can anticipate and very quickly respond to changes in the preferences of the customers.
The Japanese automakers had a short product life cycle so that the new technology, and features, can be integrated easily, and quickly in the new product portfolio. Ford also realized the same and has a plan to launch new products with a shorter product life cycle from the years 2020 to 2023.
The introduction of key features such as tire pressure sensor and transmission knob by the automakers creates a lot of buzzes which in turn plays a crucial role in the acceleration of the sales.
Auto Movements in the United States:
The automakers of the United States are facing several issues in the domestic market. The OEMs such as General Motors had decided to close their five plants in North America for which about 14,000 workers lost their jobs. Most importantly, as a result of this decision, some models are also discontinued.
On the other hand, the German and Japanese OEMs investing in the market of the United States because it is the second-largest car market and quite attractive for foreign OEMs as well. The customers have welcomed foreign brands because of the fact they deliver good value.
The OEMs are focusing on electric vehicles, autonomous vehicle and the development of cars that are well connected with digital technology. For the purpose of winning such challenges, the companies are investing, making JV, alliances, and mergers with the other OEMs as well as technology companies such as Microsoft. In the present scenario of the market, the life of the technology and products are quite short. The OEMs also need to invest in a clear and complete understanding of the customers and what exactly do they want. The customers are certainly at the center point and play a crucial role in affecting all of the other parameters. The OEMs need to create a joint venture for the short term objective.
In recent times, Toyota and Tesla signed the partnership contract with Panasonic for the development of Li-ion battery for the electric vehicles and a VW Ford partnership for the development of the pickup trucks and Vans. On the other hand, Honda and GM came together along with the Toyota and Mazda joint venture for the purpose of developing autonomous vehicles. FCA and PSA have confirmed that they are doing a 50/50 merger for the purpose of developing the new technology to jointly developed Electric vehicles and advanced front-wheel-drive platforms to be integrated into the cars for the U.S. market.
These JV/Alliances also clearly indicated that the brand position, image as well as the reputation play a much more important role in the buying process as compared to the specifications and features of the products.
Key Highlights of the report:
- The U.S. Car, SUV, Pick up, and MUV market trend and Outlook
- Value, Premium, Luxury, and Sports & high end
- The market size in volume and value
- Market Forecast
- Key Drivers of the Industry
- Macro Economy Analysis
- New Regulations and its impact
- Customer preference and choice
- Customer buying process
- Customer feedback
- Product Strategy, Position, Differentiation, and Product life cycle change
- Price and Segment Analysis
- OEMs Strategy Analysis
- Brand perception and Strategy
- Advertising impact on purchase – Digital, TV, and Print
- Customer preference analysis of value, Premium, Luxury, and High-end cars
Please send your requirement to nidhi.singh@autobei.com for customizes reports.