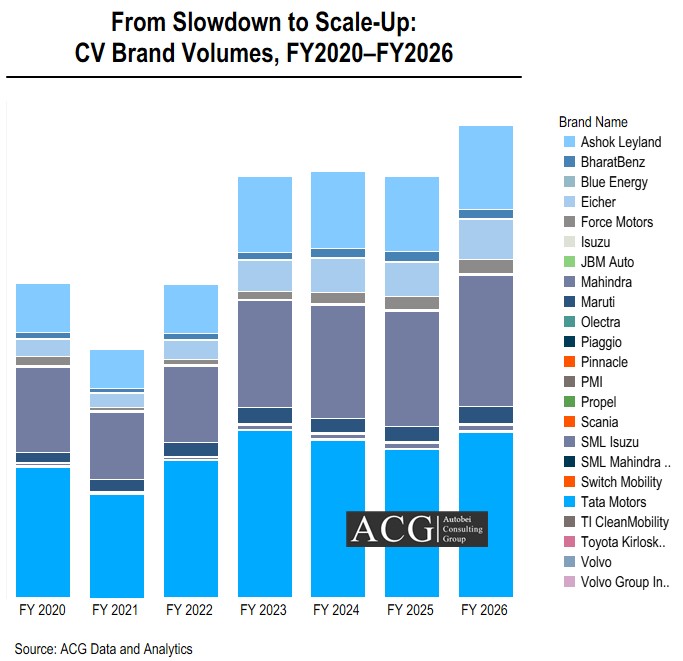
Indian commercial vehicle Market grew at a 7% CAGR between FY 2020 and FY 2026. Growth was uneven across the CV segments. It followed shifts in fleet-owner buying habits, financing conditions, and a slow move toward alternative fuels. We analyzed 25 CV sub-segments. Only 5 of them saw degrowth in FY 2026 versus FY 2025. This shows the market is broadening, not narrowing — even though growth still varies a lot by brand and category.
Indian Commercial Vehicle Industry Growth Drivers
Two forces drive CV demand. Fleet owners add new vehicles and/or replace old vehicles. Government spending on infrastructure supports both trends. Private bus operators now replace their buses sooner than before due to passenger demand for new buses. This brings purchases forward that may have otherwise waited.
Fuel Mix and the Road to FY2030
Alternative fuel CVs made up 9.3% of the market in FY 2026. Electric drivetrains made up 4.3% of that share. ACG expects alternative fuel share to reach 22–25% by FY 2030. This forecast doesn’t follow simple trend data, though. Each alternative fuel type has its own limits. CNG trucks and buses mostly run within city limits. Range limits or policy — like in Delhi — cause this. Electric trucks and buses face similar limits. They work best on short routes or fixed loading and unloading points.
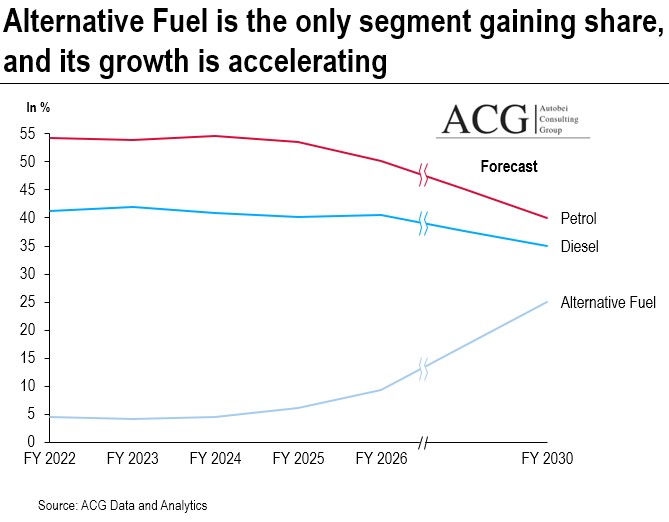
Long-haul unplanned routes don’t suit them well. So the FY 2030 number is a directional estimate. ACG built it by mapping over 100 use-cases to fuel-type fit.
Indian Commercial Vehicle Segment Insights:
Segment-Wise Performance
The SCV segment shows the biggest shift. It has lost about 10% segment share over 6 years. This share moved into the LCV and MCV segments. Each segment gained about 2% segment share over the same period.
LCV grew fastest in FY 2026, up 28%, because single fleet owners get easy loads and easy finance. The HCV segment grew more steadily. It gained about 5% of market share since FY 2020. Medium and large fleet owners are key buyers of this segment due to High upfront costs and large EMIs.
Indian Commercial Vehicle Market Competitor Landscape:
Growth Index:
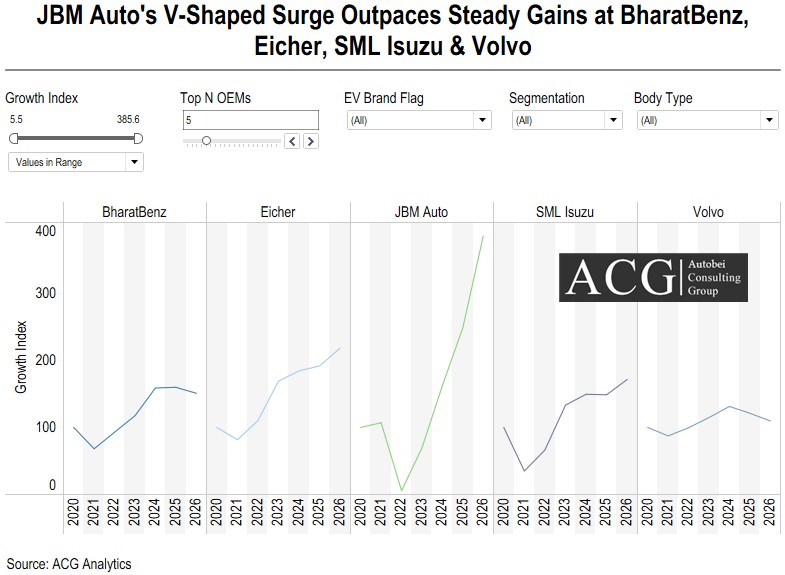
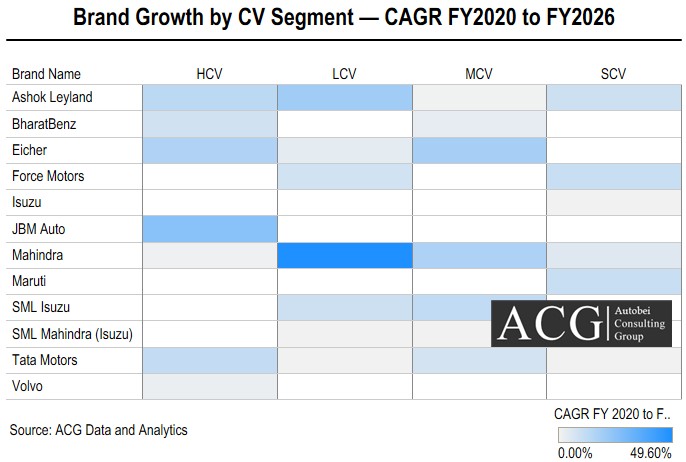
JBM Auto led the field in growth. Its strength in electric buses drove this lead. Its overall market share still stays small, though. So the growth builds from a modest base. BharatBenz, Eicher, SML Isuzu, and Volvo also grew well. Each built its growth on a clear strength in its own segment. None of them grew broadly across every category.
CAGR By Brand and Segment:
Mahindra stands out in the LCV segment. Customers increasingly prefer the brand for last-mile delivery and e-commerce. These use-cases have grown fast in their own right. Tata Motors posted more modest growth because Tata holds a strong presence in every CV segment.
The Indian CV Industry showed broadly positive growth across various segments, but it is uneven. Mahindra has exceptional growth in the LCV segment because customer prefer this brand for their last-mile delivery and e-commerce applications. Tata Motors showed modest growth since it has a strong presence in all CV segments.
Indian CV Brand-wise Market Share:
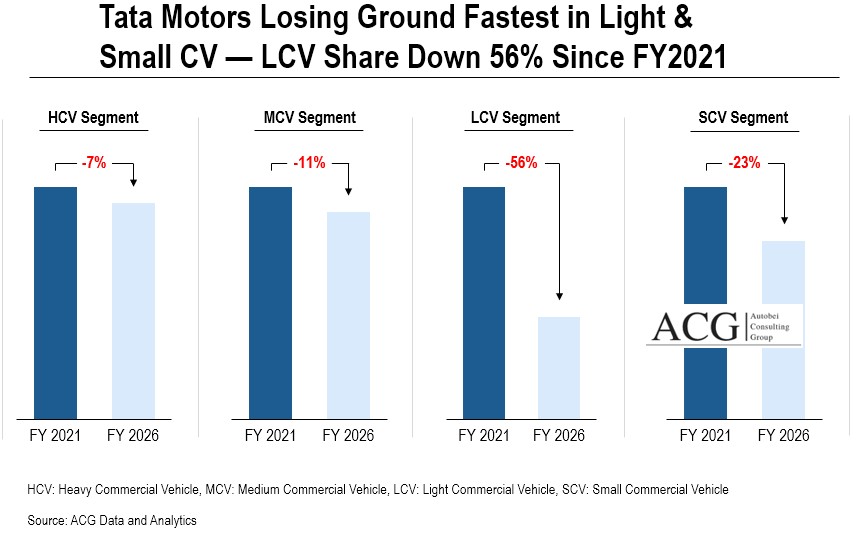
Market leader Tata Motors lost market share in every CV segment between FY 2021 and FY 2026. Tata lost more than 50% market share in the LCV segment compared to FY 2020.
 Mahindra gained the most in LCV. It gained more than 35% share in the last financial year. The price-competitiveness and mileage of the Furio range drove this gain. It now focuses on repositioning and optimizing its Truck and Bus portfolio.
Eicher gained about a 14% share in the MCV segment. New variant launches and strong mileage performance drove this gain. BharatBenz built a stronger position in heavy-duty tippers and buses over 12 meters long.
Fleet owners now give BharatBenz serious purchase consideration. Blue Energy and Olectra both lost share in the tractor-trailer and tipper segment. Scania restarted sales of its 6×4 prime mover after a long gap. Pinnacle grew its presence slightly. PMI’s share stayed largely flat.
Volume Volatility:
Sales volatility differs a lot by brand. This pattern itself carries a useful signal. JBM Auto and Switch Mobility show high volatility. Seasonal sales patterns explain this. Volvo, Maruti, Tata Motors, and Mahindra show low volatility instead. A wide, loyal customer base supports their steadier growth — even where their headline growth rate isn’t the highest.
Outlook:
The market now balances three factors: price, features, and vehicle technology. BS VI rules have pushed up purchase and upkeep costs for trucks and buses alike. This affects fleet owners’ total operating costs, profit, and availability of after-sales support. It’s also impacted brand loyalty and perception.
Contact Info@autobei.com to get the report and Data.
RECOMMENDED REPORTS

ACE Construction Model wise Sales Data
July, 2026
Indian Tipper Market
July, 2026
India’s E-Trucks: 5 km from New Corridors
July, 2026