Future Trend of Indian Bus Market is our Qualitative market report. We have identified the key trend and bus market shape in next 5 years.

Key highlights of the report:

  • Key future Trend Analysis and Market size of School, Staff, Intercity, Intracity, Mofussil, STU, Private, and Special Application.
  • Key Players
  • Branding building activities by OEMs – Application wise Analysis with the case study
  • Consumer Product and Brand perception: Tata Motors, Ashok Leyland, Eicher, SML Isuzu, Mahindra, BharatBenz, Force Motors, Volvo, and Scania
  • Economy, Premium, Luxury segment covered
  • Product USP
  • Seating capacity
  • Price range – Chassis & FBV
  • Key Models of Technical Specs (Transmission, Engine) and Features
  • Key customers
  • Sift in Future – Transmission, Engine, Bus body changes, Technology, Emission norms, Entry Step, Floor height, STU processes, Speed, Cost, and Aftersales
  • OEM Product Strategy Analysis
  • Expected changes in Purchase Decision
  • Bus Application wise Path to buy
  • Customer comfort expectation
  • Fuel wise & OEM wise Sales Analysis – Diesel, CNG, and Electric
  • Bus Fleet owner data of Bus segment
  • OEMs wise market share Analysis
  • Indian Bus Segment Industry Trend – Volume (in Units)

Indian Two-Wheeler market assessment and the outlook is our most detail analysis report. The report details and digs out an in-depth analysis of the trends of the two-wheeler market. This report also covers the assessment regarding the main segments and the sub-segments of the Indian Two-Wheeler market assessment. The assessment includes the strategies developed by the OEMs, the major market drivers, an outlook till the year 2023, analysis of the scooter and motorcycle product, market strategies for moped products, networking of the brand and other related information regarding the products and its brand value.

The report details the analysis and information regarding the market strategies for electric two-wheeler and other related product analysis also. The details and planning strategies for the product position of electric scooter, pricing of the product, size of the market, customers purchase pattern, key products of the brand, Major competitors in the market, setting the target segment, uses and benefits of product, limitations of the product, strategies developed by the OEMs, policies and guidelines specified by the  government concerning the electric vehicle policy, discount schemes, analysis and forecast of the running cost will be taken into account for report. ACG segregates the product categories into low Cost, economy, executive, high end, power, and the cruiser segments.

Motorcycle and Scooter Sub Segment Analysis

The major specifications covered under the product analysis section are categorised as the price range of the product, features and facilities of the product, market share of product-based classification, comparison of the product with the competitor’s product, highlighting features, differentiating the specification and the uses of the product, and life cycle of the product.

The brand value and the product position in the market, branding activities for high sale value, the theme of the brand, celebrity advertisements for market impact, and overall brand strategy will be detailed and covered in the brand analysis.

The case study of Gandhinagar city, in the state of Gujarat, is included to showcase the spiking market growth for electric two-wheeler and a higher sales growth in this segment in the year gone by.

Some segments have a higher CAGR but confined to small market size and some segment would have the large market size by the year 2023 with the low CAGR. OEMs, financiers, and the major component manufacturers develop and plan strategy depending on following market scenario:

Indian Two Wheeler Market Scenario 2023

A season of good monsoon, better and improved rural economy focused budget and overall positive economic forecast should build and spike up the two-wheeler sales in the upcoming part of the year 2018. Growth expected in the rural economy is one of the major driving points for the motorcycle segment.

The current market size of the Indian two-wheeler is around 20 million units which are considered to be 2 million units more than the previous year. The major export volume is around 3 million units in the current year 2018 which is approximately 1 million units more than the previous year 2017.

Indian-Two-Wheeler-Market-Overview-and-OEMs-market-share

Motorcycle segment will register double-digit growth in the coming five years, and there is a continuous and impressive growth of 20% in the scooter segment for the year 2018.  There is a reduction of segment share gap between the scooter and the motorcycle from 63% to 29% between the years 2009 till 2018. In the export category also, the motorcycle segment registered growth of 14.3 %. The Scooter segment highlighted a 6.4 % growth whereas the moped segment highlighted a de-growth rate of 22.7 % for the year 2018 compared to the year 2017. The share segment of motorcycle export has also increased by benefiting rate of 2% and the scooter segment share in the export market has reduced by a solid 1 %.

Motorcycle and Scooter Trend and Running cost

The running cost of the product, smooth driving experience and the multi-purpose uses and features of scooters are the major key factors for the growth of the scooter segment.

  • Scooters will have low running cost when compared to the motorcycle of same engine capacity.
  • In the first year of running, both scooters and motorcycles will have almost zero maintenance cost. Oil and Filters cost which comes under regular maintenance is excluded.
  • In the second year of running the motorcycles will have 15% more running cost when compared to the scooters.  The higher cost is due to cables, brake shoes replacement and maintenance.
  • In the third year of running the motorcycles will have 30% more running cost as compared to the scooters. The clutch plates, chain, sprockets, and other components will have to be replaced and monitored with continuous maintenance procedures.

The two-wheeler market is becoming too dynamic and fast growing. The major share of the customers is shifting from one segment to another one frequently and they are willing to choose a product which will give some value addition to the product.

Please contact at Info@autobei.com to get the Table of Content and Price.

ACG exclusively released the Bus sales data based on Length of Bus, Different Bus Application, State level, City level and Brand wise Bus Data in one format. Bus length plays an important role to create product Strategy. It also helps to make Business planning, Target segment, Competitor Analysis, Electric Bus planning, Component Manufacturers and other Bus Industry STake holders.

This data is available from FY 2012 to FY 2018 and CY based from 2012 to 2017 and quarterly/ yearly forecast on request.

Length, Application, State and Brand wise Bus sales Data

The following States are covered:

  • West Bengal
  • Rajasthan
  • UP
  • UK
  • Chhattisgarh
  • MP
  • Maharashtra
  • Assam
  • Bihar
  • Jharkhand
  • Orissa
  • Goa
  • Tamilnadu
  • AP
  • Karnataka
  • Gujarat
  • Haryana
  • Himachal Pradesh
  • J&K
  • Punjab

Length, Application, Cities and Brand wise Bus sales Data

Following Cities are covered:

  • Delhi
  • Jaipur, Udaipur
  • Dispur,Guwahati
  • Thirvananthapuram, Kochi
  • Chandigarh
  • Allahabad,Lucknow,Kanpur,Agra,Moradabad,Varanasi
  • Chennai,Coimbatore
  • Shimla
  • Nainital /Dehradun
  • Patna
  • Ahmedabad, Vadodara
  • Srinagar
  • Raipur
  • Dhanbad, Ranchi
  • Hyderabad, Kakinada, Vishakapatnam
  • Chandigarh, Ludhiana
  • Bhopal, Jabalpur
  • Bhubaneshwar
  • Mysore, Davangere, Belgaum, Bangalore
  • Sholapur, Mumbai, Pune, Vidharbha region
  • Kolkata
  • Goa

Additional Information:

  • AC / Non AC Buses in India by state
  • In City, Intracity and Intercity split between private ownership and Govt Local State Transport Undertakings (STUs)
  • Overall Bus Parc in India: Split between Govt and Private – Stae wise. A number of buses by private operators.
  • Across segments daily KM run. i.e. average daily kilometers covered by Intracity buses, intercity buses operated by private operators and Govt Transport Undertakings
  • Operating Cost: Per Km Cost, Define the operating cost as per industry i.e. STUs (intercity and intracity), school bus operators, employee transfer
  • Aging Data of vehicle parc


Indian Auto Industry showed excellent growth in FY 2018. The Industry is going through some major changes in the last 3 years in terms of Technology, Regulation, Customer buying preference, Digital Platform, Electric Vehicle, and new product range.

The Industry registered 11 percent CAGR between FY 2009 to FY 2018. Two Wheeler Industry which is having about 80 percent segment share registered highest Compound annual growth of 11.7 percent, Passenger Vehicle (Private & Taxi) 8.7 percent, Commercial Vehicle 9.3 percent, and Three Wheeler segment registered around 6.9 percent between FY 2009 to FY 2018. All segments of Indian Auto showed positive growth in FY 2018.

Indian Automobile Industry Analysis and Outlook 2023

The life cycle of the product is another aspect which is important specially for Cars and SUV segment.

The PV OEMs need to make a rich product portfolio and keep updated on every part of the life cycle. We have analyzed the most important Short, Mid and Long-term factors for Passenger Vehicle, Commercial Vehicle, Two Wheeler, and Three Wheeler segment.

Indian Automobile Segment Analysis FY 2018 and Sales Production and Export Outlook 2023

Export Market: Passenger Vehicle and Commercial Vehicle showed de-growth in FY 2018. Foreign OEMs are mainly focusing on the export market like Africa, Sri Lanka, Bangladesh, South East Asian countries. Two Wheeler, Three Wheeler and Industry TIV registered growth in FY 2018.

Indian Automobile Export Analysis FY 2018

Highlights of the report:

  • Indian Automobile Trend and Outlook 2023
  • The market size of each segment (By Volume & Value)
  • Segment Analysis
  • Investment plan and Actual
  • OEMs profile, Sales, Production and Export Analysis
  • Segment wise Market size and key players
  • SWOT Analysis
  • Upcoming new products
  • Market Drivers of each segment
  • OEMs detail strategy Analysis
  • Govt policy and regulations and its impact
  • Expected changes in the Indian Auto Industry
  • Brand Analysis and Brand Position
  • Product Analysis and Product Position

To get the Table of content and Price of the report, please write the E-mail to Info@autobei.com

Indian Bus Industry Market Analysis is critical data collection from various sources. The following information is the part of the report:

  • Indian bus market overview – Market size, market share, and major players
  • Latest Industry updates
  • Key changes in Industry
  • Chassis and Fully built Product sales Analysis
  • Lengthwise Sales & Demand Analysis – (7-8m, 8 to 10m, 10 to 12m and more than 12m)
  • Sales trend and Demand Analysis by GVW
  • Sales trend and Demand Analysis by Number of seats
  • Sales trend and Demand Analysis by Application wise
  • Sales trend and Demand Analysis by Engine position
  • Sales trend and Demand Analysis by Fuel type (Diesel, CNG, and Electric)
  • Sales trend and Demand Analysis by Transmission type
  • Sales trend and Demand Analysis by Comfort type
  • Bus Sales Trend and Demand Analysis by Bus height – High Floor, Low Floor, Semi Low Floor
  • State wise lengthwise sales volume
  • State wise Application Bus volume trend and Forecast
  • Costing of Bus body
  • Segment analysis – Product, Price, Zone, State and Business models
  • Product Analysis – USP, product gap analysis, and deployment pattern
  • Customer behavior – & demand analysis
  • Business environment
  • Major export market
  • Used vehicle analysis
  • Company analysis
  • Pricing analysis – Business models for different segments
  • Cost of vehicles
  • Under Application like Region, corporate, school, tourism and type of routes – Peak and normal hour frequency on the route, an Average number of passengers per day per journey, Number of buses operated on the route and bus trip per day per bus.
  • Market Dynamics
  • Segment and sub-segment trend – Current and forecast
  • Cost of segment-leading vehicles
  • Market trend – Current and forecast
  • Product positioning trend
  • Brand position in each segment
  • GST impact, Homologation process, and timelines
  • The new regulation, and Passengers Expectations
  • Key customer and their fleet portfolio, Tender Process – Win & Loss, Technology Roadmap Witnessed, Financing option and Key financiers, past launches and Upcoming launches
  • Number of seat availability Analysis
  • Model-wise Product USP
  • Brand awareness activities
  • Key Strategic Customers detail
  • Model-wise Bus Technical specs and features
  • OEMs included Tata, Ashok Leyland, Force Motors, Volvo, BharatBenz, Scania, VECV Eicher, SML Isuzu, and Mahindra
  • Govt regulation and its impact on Industry
  • Electric Bus Market Analysis
  • After Sales Analysis, and spare parts pricing
  • Driveline Analysis
  • City wise Bus Sales Data
  • Model-wise Sales and Production data
  • Private Bus volume Vs STU Bus Volume
  • Model and Application wise TCO Analysis
  • Model-wise Production Trend and Forecast
  • Low cost, Budget and Premium Bus Market Analysis
  • Bus Component Supplier Database

This critical information is available in PPT, PDF, and Excel Format. Please send your requirement to get the quote to Info@autobei.com. There are several database and reports available on Global Bus Market

Indian Truck Market is witnessing many major changes in the last 3 years and it is expected to see some more major changes in the next 10 years. The market size of Indian Truck in 2018 is around 0.79 million units. The combined segment share of the Small & Heavy Duty truck segment is more than 85 percent in the current fiscal year. The market is expected to reach 1.2 million units by 2030. Most of the product up-gradation and new launches belong to the Value plus segment which makes it the largest market segment. Even Daimler and MAN Truck decided to enter into this segment in India.

Indian Truck Industry Trend and Outlook FY 2018

Indian recent economic reforms and expected GDP growth create positive market sentiments. Govt is implementing some new safety norms which will be implemented in the next 2 to 3 years.

The industry is shifting towards a heavy segment due to better TCO and ROI. This year 31T plus segment overtake 25T segment. Tractor Trailer showed a 60 percent growth in FY 2018 compares to last year.

In 2010, the industry was dominated by a low-cost truck with low horsepower and Cabin Chassis Truck models. By the end of 2017, the low-cost segment moved to the Value plus segment. The premium segment is still struggling to get good sales volume due to its low ROI.

Indian Truck Market Report FY 2018 - Premium, Value plus and Low cost

Tata Motors is a market leader in the Truck segment. The company is having a double-digit segment share in all sub-segments. Ashok Leyland, Mahindra, VECV Eicher are strong in some specific segments.

Truck OEM Market Share FY 2018

Report Highlights:

  • Indian Truck Industry Market size and Outlook 2030
  • Definition of Premium, Value plus and Low-cost segment – Market Dynamics, Market Driver, Price, Segment size and Outlook, Key Models
  • Mini Truck Segment Analysis
  • Pick up Truck Segment Analysis
  • Light Duty Truck Segment Analysis
  • Medium-Duty Truck Segment Analysis
  • Heavy Duty Truck Segment Analysis
  • Special Truck Segment Analysis
  • Rigid Truck Segment Analysis
  • Tractor Trailer Segment Analysis
  • OEMs Product mapping and its presence in segment and Sub Segments
  • OEMs Product Strategy Analysis
  • Model-level product position, Specs and Features
  • Application wise Market Analysis
  • Brand Analysis
  • Competitor Analysis
  • OEMs Market Share fluctuation
  • Product Lifecycle Analysis
  • Product USP
  • Customer pain area
  • Customer Satisfaction Analysis
  • Customer, Application and Product mapping

Fleet owner Survey:

  • Types of Transport companies (Low Budget Segment, Value plus Segment, Premium Segment), Influencer, Decision-making – Company size, Fleet & Company profile, Application, Portfolio, Truck type, Fleet size, Make
  • Purchase Criteria for each segment – All factors included
  • After Sales Survey: Maintenance, Repair, Response time, Warranty, On road assistance, Spare parts etc.
  • Brand Perception: Pricer & QUality and Segment comparison based on perception of brand

ACG is conducting mega Commercial Vehicle (Truck & Bus) fleet owner survey in India. In this survey, we cover around 1 lakhs fleet owners across India. We are creating history by doing this mega-survey to check the pulse Indian Transportation Industry. We discuss their latest Industry issues, Future plan for buying new trucks, Product promotion, Vehicle Utilization, Branding activities, OEMs sales people & Dealers feedback with rating, Product feedback (Technical, After Sales & Features) – Maintenance, Comfort, Seat, Daily running time, 5 Best Product features, 5 worst product features, Social life, ROI, Finance for vehicle purchase, Most influence parameters to buy truck and Bus, OEM support, Product Support, the Future expectation from the product, Vehicle Application, Drivers wages, Product & Brand loyalty. Loyalty, Purchase pattern, Language, Most effective advertising platform, Education, Health, Family, Reading habits, Price expectation, Fuel consumption, Vehicle Vibration, Productivity, Acceptance of Automatic, Semi-Automatic and Manual Transmission, How technology play role in their business, Age of Business, Driver experience, How many drivers started to use Smartphone, Business sentiments, Market dynamics, Regulation impact, Ground level changes after GST implementation and E waybill system.

Survey Frame:

  • Fleet size: Small Fleet Owners, Medium Fleet Owners, and Large Fleet Owners
  • Truck type: Small Truck, Pick up Truck, Light Duty Truck, Medium Duty Truck, and Heavy Duty Truck. Rigi Haulage, Tractor Trailer, Tipper (Mining & Construction),
  • Application (More than 60 type of Application): ODC, Special Application, Vegetable, Parcel, Inter-city transportation, Container, Voluminous goods, Disaster management, FMCG, Vehicle Transportation, Heavy Machinery and COnstruction material transportation and others
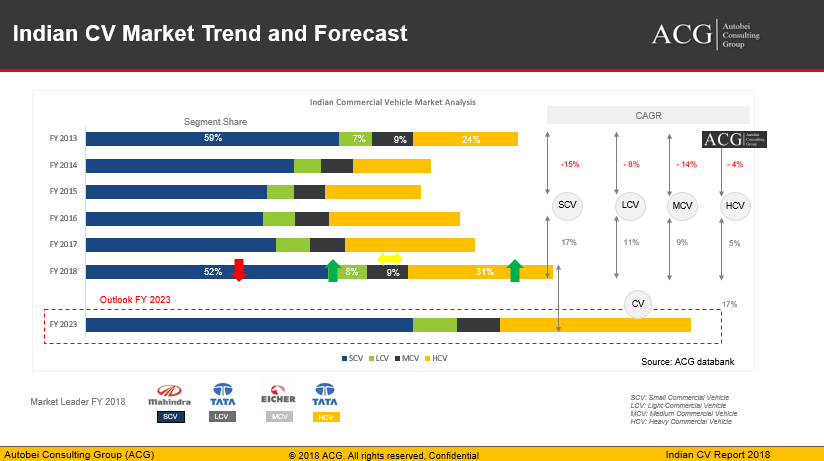
  • Brand-wise: Tata Motors, BharatBenz, Ashok Leyland, Mahindra, Volvo, Scania, Eicher, Force Motors, Piaggio, AMW, SML Isuzu, and Isuzu

This survey is helpful for the company to promote their product or services for Commercial Vehicle Industry, Planning to launch the new product, Business Planning, Product, Sales, Marketing and Aftersales Strategy review, Branding and Promotion planning & budget with maximum ROI, Introduce new product features or product up gradation, Configure the new product, Pricing strategy, Understand the fleet owner business model, region wise understand the fleet owner behaviour, Driver training.

Region: South, North, East and West Zone

Following States includes:

Andhra Pradesh, Assam, Bihar, Chhattisgarh, Delhi, Goa, Gujarat, Haryana, Himachal Pradesh, Jammu Kashmir, Jharkhand, Karnataka, Kerala, Madhya Pradesh, Maharashtra, Orissa, Punjab, Rajasthan, Tamilnadu, Uttar Pradesh, Uttaranchal, Vidharbha, and West Bengal

This is a detailed report on Indian commercial vehicle industry’s the on-going trends and the outlook for the year 2018. The ultimate aim of this report is to find out the reasons why and how the segment share and growth has changed in previous five years. This report also details on what and how the industry will like look like in upcoming five years.  The main reasons for the changes in OEMs market share in the main segment and their every sub-segment will also be signified in this report. The Indian Commercial Vehicle has registered a growth rate of twenty percentages in the domestic sales segment. The Indian Commercial Vehicle Industry has shown a de-growth of 10 percent in export for the year 2018 compared to the previous year 2017. The current market size of the Indian CV is approximately 8.7 lakhs units for the year 2018 included MAN, DICV, and Scania. The Industry has anticipated a double-digit growth for the year 2019 for SCV and HCV segments.

Recently ROI is also changed of Premium Truck and Bus product and fleet owner expected to reduce ROI cycle at least by one year.

ACG expected that Value proposition solution and vehicle utilization will be next game changer for the Industry.

Indian Commercial Vehicle Market Analysis 2018 and Outlook

The government has recently initiated five major steps in N and M category vehicles for safety standards. The development of infrastructure, growth of economy, replacement cycles, the new and upcoming rules and regulation, transportation of heavy goods and machinery, growth in the construction and mining segment, advancement in technology, E waybill systems, new safety norms, telematics, high demands are expected in the rural economy due to normal monsoon, overloading ban, hub and spoke model started to work on the ground are the major initiative and the key drivers for development and growth of industry. The Ministry of road transport was successful in building 9829 kilometers of National Highways during the year 2018 which is approximately twenty percent of growth compared to the previous financial year.

New systems like the emergency button and GPS tracking devices will be made mandatory accessories for selected vehicles. The OEMs will have to pass the changes to initiate the technical changes which will cost a good amount. The year 2018 registered a huge growth for the tractor-trailer, Tipper, and 31T plus rigid haulage. ACG expected that value proposition solution and utilization of vehicle can be considered as the next game changer for the industry. The report included Product/ Make presence in every segment, its position, Specs, Features, Application, and other key information.

Ashok Leyland has been successful in narrowing the gap against its competitors and improve their market share in all major segments. Tata Motors has lost a valuable 12.5 percentage of market share in CV segment.  Ashok Leyland, Mahindra, and Eicher have increased their market share compared to their competitors. The OEMs are mainly focusing on the introduction of new product and their up gradation. In the year 2018 Tata Motors have successfully narrowed the gap with Mahindra and now it is just a mere 7.5 percentage difference in market share in SCV segment. Tata Motors made a change in market share value from a range of 26 percentage to 28 percentage with Eicher Motors in the LCV segment. In MCV segment, Tata Motors has also made a change of market share value of two percentage with Eicher in the MCV segment whereas they have made an improvisation in the HCV segment by increasing the market share value from 33 percent to 36 percent in highly registered HCV segment. Ashok Leyland is taking up the huge initiative to narrow the gap with Tata Motors since the year 2013. The detailed analysis covers and mentions each segment and their sub-segment of the Indian Commercial Vehicle Industry.

Ashok Leyland Commercial Vehicle Segment Performance Analysis

There has been a detailed discussion and various meeting with the fleet owners, established professionals, market dealers, financiers, and experienced drivers to have their opinions about the product and expectations and details of large medium and the small fleet owners.

Fleet Owner Survey

Report Highlights:

  • Market size and growth
  • Market outlook
  • Expected segment shifts and the current trend
  • OEMs performance in terms Product, Sales volume, and Market share
  • SCV, LCV, MCV, and HCV segment Analysis, Major products, Price range, Market dynamics, Market drivers, challenges, Sub Segment movement, Product USP, Product life, Operating cost, After-sales business practice, Products specs and features, Competitor Analysis and Application
  • Product lifecycle
  • Key products
  • Soft offering
  • Network Analysis
  • New Product launches and upcoming products
  • The starting point for Electric Commercial Vehicle
  • Product and market size mapping of each OEMs
  • Low cost, Value plus and Premium CV segment
  • Product portfolio
  • Horsepower wise Vehicle sales analysis
  • Nest 5 years sales forecast
  • Macroeconomy Analysis
  • Primary Survey of Fleet owners of Truck and Bus – Product Issues and USP
  • Gap Analysis
  • Brand promotion activities
  • Brand perception – category wise
  • Model-wise and Application wise TCO is available on request

Indian Electric Bus Report is our latest market intelligence report. The report gives complete Industry insight, Demand, Forecast and Product Analysis of Electric Bus.

Highlights of the report:

  • The latest development on Electric Vehicle & Electric Bus
  • Roadmap of E Bus
  • Stakeholder Analysis
  • Global Overview of E Bus Market
  • Indian Bus Industry structure
  • Current Indian Bus Industry Analysis
  • Electric Bus concept in India
  • Classification of Electric Buses
  • Feasibility study
  • Electric Bus Market size – Trend & Forecast 2030
  • Market demand Analysis of Electric Bus
  • Bus lengthwise product mapping and demand analysis
  • Buying Trend and customer response/expectation
  • Expected growth forecast
  • Product Specs and Features
  • Key Products
  • TCO Analysis & Operating cost Analysis
  • Application Analysis
  • After Sales Support require
  • GOI Policy Initiatives
  • Green Urban Transport Scheme
  • Market Drivers
  • Daily Average fleet run
  • Bus Performance
  • Advantages for all stakeholders
  • Bus Application wise Analysis
  • Voice of customers
  • Pricing Strategy
  • Tender opportunities
  • Suitable State-wise and City-wise Analysis of Electric Bus along with the Market size
  • The real-time case study with other alternative fuels
  • Battery technology
  • TCO Analysis
  • Procurement of Electric Buses
  • Challenges & Opportunities
  • OEMs product strategy for Electric Bus market
  • OEMs partnership Analysis
  • Charging infrastructure Analysis and requirement
  • Upcoming new players in this segment
  • Effective Branding Strategy and activities
  • E bus competitor Analysis
  • Comparison of Diesel, Hybrid, CNG, and Electric Bus
  • Energy losses Analysis
  • E Bus Component Analysis
  • Supply chain Analysis
  • E Bus Technology Concept

Greenfield Project Support service:

  • Project Feasibility Report
  • Setup Electric Vehicle Factory
  • Manufacturing Cost Analysis
  • ROI & Risk Analysis
  • HR Planning and strategy –
  • Export Strategy

French Auto Industry Trend and Forecast report cover last 10 years market trend and next 5 years Industry Outlook.

Report Highlights:

  • Country Analysis
  • Economy Overview and forecast
  • French Automotive Industry overview
  • French Economic outlook and its impact on French Auto Industry
  • Industry latest Development
  • SWOT Analysis
  • Car, Truck and Bus Volume Trend and Forecast Medium & Long term)
  • Brand & Model wise Sales and Production Trend and Outlook
  • French Auto Industry compare to Non-French OEMs
  • Competitive Landscape
  • OEMs Strategy Analysis
  • Industry Drivers for PV and CV
  • Customer preference for buying the new vehicle
  • After Sales Business practice: Organized Vs Unorganized
  • New Product launch
  • Branding activities
  • Customer segmentation
  • Product Lifecycle
  • Key product features and Technical specs
  • Best selling models
  • Brand position for every segment
  • The upcoming new product range and product features
  • Model-wise product Price
  • Vehicle Maintenance Analysis
  • Electric Vehicle Analysis
  • Government regulation and its impact on Auto Industry
  • Overview of other key analysis
  • Additional points – DOing Business in France
  • Cultural Analysis – Hofstede Dimension


Electric Commercial Vehicle Report is our detail report on Global EVs. This report cover Sales, Market Share, Price, After Sales, Network Analysis, Sub Segment (Urban City, Three Wheeler, Light Duty Truck, Medium Duty Truck, and Heavy Duty Truck)

Highlights of the Electric Commercial Vehicle (LCV, MCV, and HCV) Report:

  • Segment: Truck, Bus and Three Wheeler
  • Demand Analysis
  • Overview of the Global and Indian Electric Commercial Vehicle Industry
  • Current Market Assessment
  • Customer buying and expected for EVs
  • Product and Market Mapping
  • Product Lifecycle, Product Age, Product issues, and Product Age
  • Application wise Product suitability and Adaptability
  • Key challenges and Advantages of CV EVs
  • Top segments for entry
  • Segment wise Sales Forecast, Market share and Expected growth by 2030
  • OEMs strategy Analysis
  • Business case Analysis
  • Powertrain Analysis
  • Market Survey
  • Vehicle Operating economy (TCO)
  • Price Analysis
  • Brand Strategy for EVs
  • EVs Competitor Analysis
  • Regulation changes
  • SWOT Analysis
  • EVs Key players
  • Key Component Suppliers
  • Market Forecast covered 45 markets
  • Global Segment wise Sales Forecast
  • Key Market drivers

Special Consulting Project:

  • Business environment
  • Country Analysis
  • Production/ Assembly plant setup
  • Coordination with Government/Authorities requirement
  • Choosing plant location
  • Project Cost Analysis
  • ROI Calculation
  • Risk Analysis Report
  • Human Resource Support

Indian Automotive Industry Analysis FY 2018 is our latest report on Indian Auto Industry.

Our Report answers the following questions:

  • Volume Trend & Forecast (Two Wheeler, Three Wheeler, Truck, Bus and Passenger Vehicle)
  • How will be the Sales, Production and Export outlook of Industry
  • What is the Segment size in terms of Volume and Value
  • Which segment shows the highest growth performance
  • How sub-segment shifting to other segments
  • What are Industry key challenges from 2018 to 2020
  • Top players in terms of Market share and Volume
  • What is expected technology trends
  • How Electric Vehicle will take shape
  • What are key Drivers and how it is impacting each segment
  • Last year key product launch
  • Upcoming Key products
  • What are the key products in each category, Technical specs, price and Features
  • How product grid look like in 2017 and expected portfolio in 2019
  • Marketing Strategy adopted by Industry
  • What is the pricing trend expected in 2018 & 2019
  • Industry SWOT Analysis
  • How Macroeconomy impact on Auto Industry
  • OEMs strategy from 2018 to 2020
  • How customers are changing buying preferences
  • How Brand Strategy changing with time and Technology