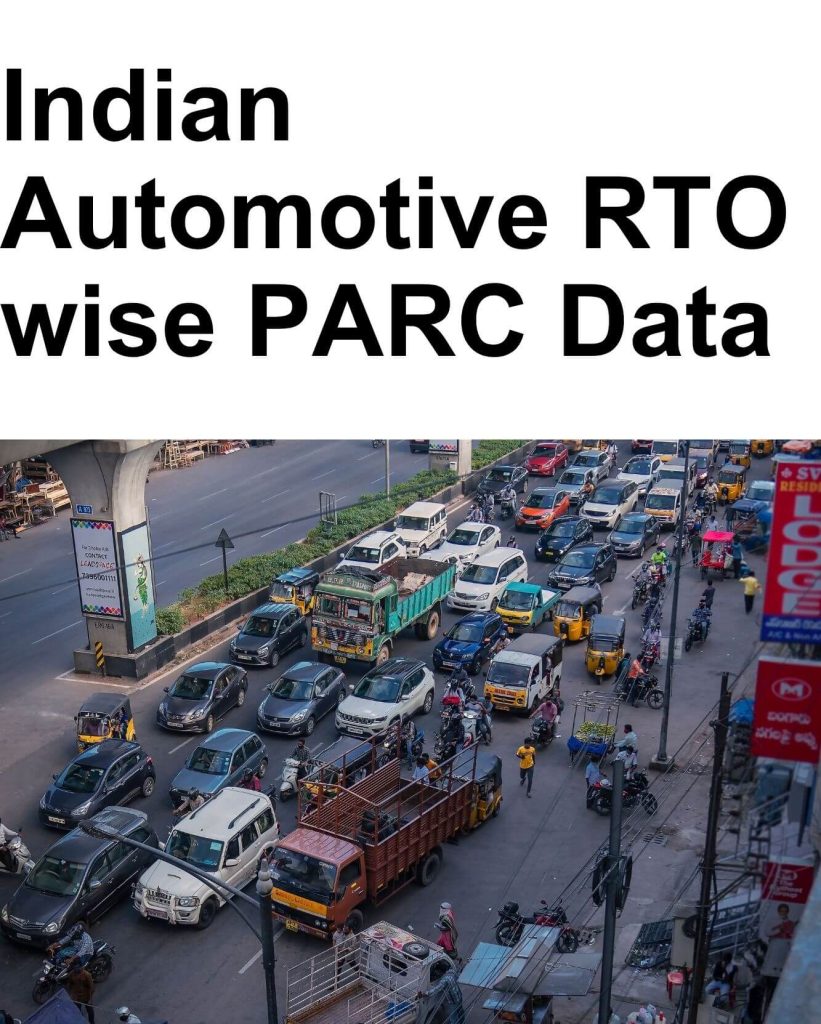
The Indian automotive market moves fast, and we find direction. New launches, discontinuations, shifting fuel mixes, changing price bands, and changing buyer behavior all reshape the Indian Automotive competitive landscape every quarter. Without accurate, structured data, it’s difficult to spot these shifts early enough to act on them.
That’s where high-quality Indian automotive data plays a key role — not just tracking what happened, but as a basis for what to do next.
Who are our Indian Automotive Data Subscribers:
Our datasets are built to serve all stakeholders of the Automotive Industry:
- OEMs — For product planning and strategy, competitive benchmarking, and white-space analysis across all segments, Price bands, and body types.
- Financial institutions — For market sizing, forecasting, and investment decisions in the automotive and EV sectors.
- Suppliers — For demand forecasting, expansion plans, Manpower hiring, Technology Investment, and understanding which OEMs and segments are growing fastest.
- Others: Branding firms, leading Consulting and Research firms, and Fuel companies.
Regardless of your Industry role, this data is framed to meet our clients’ needs directly, providing the numbers to support your goal.
How the Data Is Delivered
We know different teams are comfortable with different data formats, so our Indian automotive data is available in various formats to suit you best:
- BI Tool dashboards — Live, interactive views for ongoing tracking (Tableau and Power BI)
- Excel workbooks — Properly structured spreadsheets with calculations ready for further analysis
- Raw data — Clean, unformatted datasets for teams who want to build their own Data models from scratch and customize
- Deep analytics (Decision on your fingertips) — Pre-built market share, CAGR, Product position, growth, segmentation, and white-space analysis, delivered as a finished report
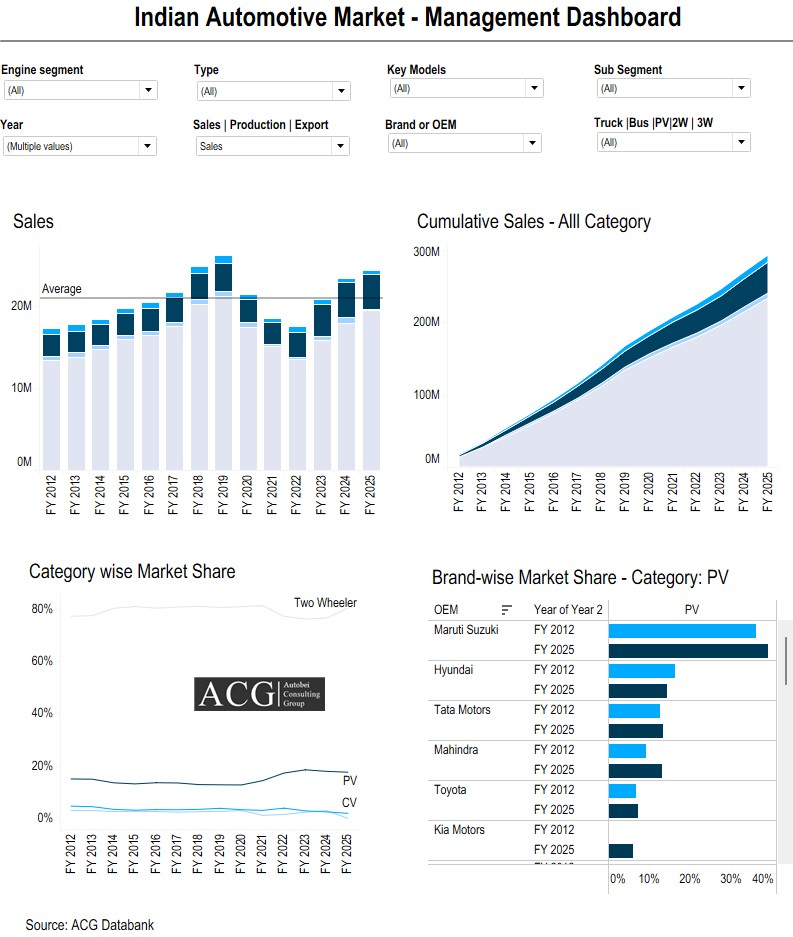
Deep Analytics: Complex Data, Made Easy to Act On
Raw automotive data on its own doesn’t tell you what to do next, but certain benefits also depend on how it’s used. Our deep analytics connects the dots — showing the relationships among different data points, what they mean, and the key takeaways you can act on immediately.
We handle the high level of complexity so our clients don’t have to. The output isn’t an unclear picture of numbers; it’s a ready-to-use, clear tool you can use to build your strategy.
Trends and Forecasts, at Every Level of Detail
We track trends and forecast data on a monthly, quarterly, and yearly basis, so you always have the option to set the time horizon for the decision at your fingertips.
The depth goes further than most market data available today. We touch on variant-level sales and RTO-level granularity — making this some of the most detailed, macro-level automotive data available anywhere.
A Complete Picture, Not Just Numbers
We map product data alongside the context that makes it meaningful:
- Key technical specifications
- Features
- Buyer groups
- Other market dynamics
Analyzing these together turns a plain sales number into a clear, complete picture — trends and forecasts become visible at a glance, not buried in a spreadsheet.
Every forecast is backed by real assumptions and regression analysis — grounded in industry dynamics and other market factors.
Why Sales Actually Change
Numbers alone show what happened, but we explain why it happened.
Our analysis identifies the key reasons behind changes in sales volume, CAGR, market share, growth, and degrowth — combining two layers of insight:
Qualitative factors — customer surveys, buyer sentiment, and on-ground feedback
Macroeconomic factors — industry performance, new product launches, policy changes, and broader macro-level analysis
This is often the most valuable part of the analysis, because it turns a data point into a decision-ready insight.
Built on 15 Years of Automotive Industry Experience
This exclusive data is not assembled overnight by ACG. It is the result of 15 years of continuous work within the Indian automotive industry, with suppliers and dealers, tracking OEM launches, pricing shifts, powertrain dynamics, and segment-level demand as they occurred each quarter and month.
This long-term perspective makes the data genuinely valuable for business decisions. It gives insight and talks to the data.
Various Types of Automotive Data, In One Place
Our coverage spans nearly every data type the industry needs. If you are part of the Indian automotive market — as an OEM, a financial institute, a market research company, or a supplier — this is the kind of accurate data that helps to make the right decision.
Want to see DEMO? Get in touch to discuss format type, data fields — BI dashboard, Excel, raw data, or a fully built analytics report — that fit your project requirements.
Indian Automotive Data scope:
Period: 2001 to current years + next 10 years Forecast
Industry Level: Vehicle:
- Truck
- Bus
- Commercial Vehicle
- Two Wheeler
- Three Wheeler, and
- Off-road vehicle
Data Type:
- Vehicle Sales
- Vehicle Registration Data
- Vehicle PARC Data
- Vehicle Inventory
- Customer Loyalty
Power Train type:
- Electric
- CNG
- Petrol
- Diesel
- LNG, and
- Hybrid
Automotive Product Data:
- Brand
- Segment
- Sub-Segment
- Body Type
- Model
- Variants – Technical Specifications (With their interpretation)
- Price
- Product USP, and
- User Group