Tag Archives: Tata Motors

Tata Group is an iconic brand based out of India. The Tata brand is respected and trusted worldwide.

Tata Motor Automotive business is primarily divided into two main categories:

In the last few years, Tata Motors experienced losing its grip on some of the automotive segments and sub-segments of Cars,  Trucks, and Buses.
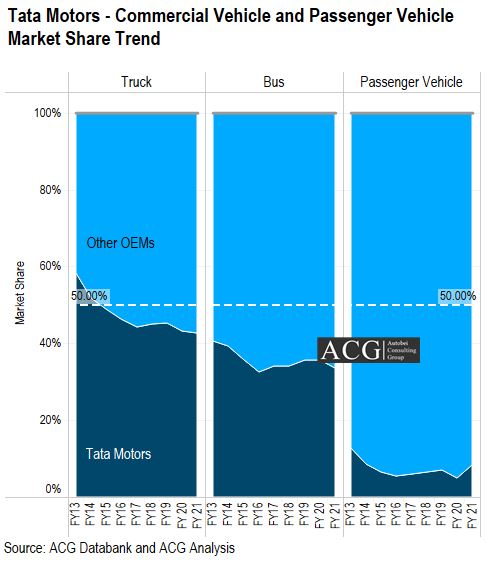
Tata Motors Commercial Vehicle and Passenger Vehicle Market Share Trend Analysis

Tata Motors increased its market share by launching a new product range in the SUV and Car Segment.
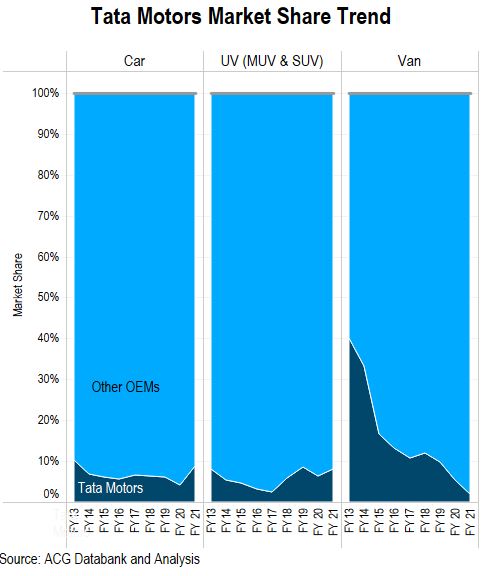
Tata Motors Car SUV and MUV Market Share Trend Analysis

There are basically five main components a business relies on:

  • Brand Experience, perception or image
  • Customer’s consideration to Trust, like, and buy it
  • Customer Satisfaction
  • Rich Products portfolio,..no but the suitability of product as per customer needs, demands, and expectation

Tata Motors greatly started to focus on its Product range, Price point, Features, Design, Style, Customer segment, and Dealer involvement.

Tata Motors, a company formally known to have established an offering of affordable product range, appears to have been drifting away from that image. The company now manufactures vehicles for ValuePlus, Premium, and High-end segments in the passenger Vehicle category for medium Middle, Upper Middle Class, and Affluent income classes. There is no product available for lower and Elite class income class.  Launching new models for these two income group customers could increase Tata Motor’s market share by 5 to 7%.
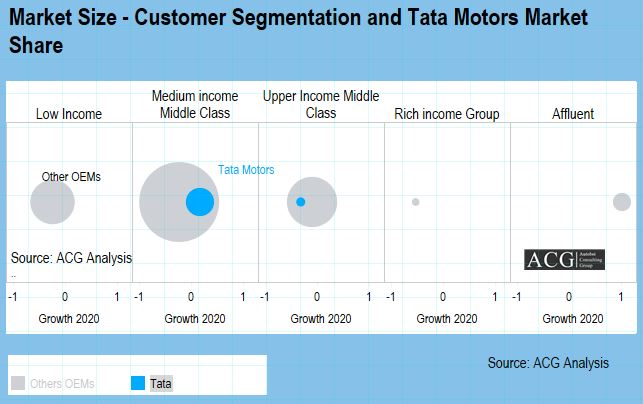
Market Size - Customer Segmentation Analytics and Tata Motors Market Share

The Medium income Middle-class customer segment owns 67% of sales of cars, SUVs, and MUV shares and is one of the most significant segments in the Indian PV segment. At present, Maruti regulates this segment with 12 models while Tata has only 4 models.
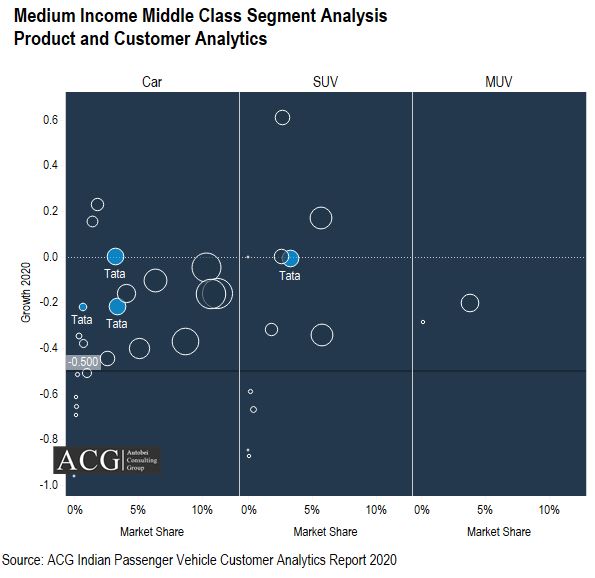
Medium Income Middle Class Segment Analysis- Product and Customer Analytics

In this segment, the Relative market share of Tata Motors climbed from 11 to 17.5% between 2017 to 2020. However, Tata remains the second-best performer in this segment by increasing 6% relative market share with just 4 models.

Tata Motors Segment, Product, and Market Analysis: Upper Income Middle-Class Group:

The Upper-income Middle-class group customer contributed 11% segment share in Tata Motors SUV Sales in 2020 as per ACG Customer Analytics Report 2021.
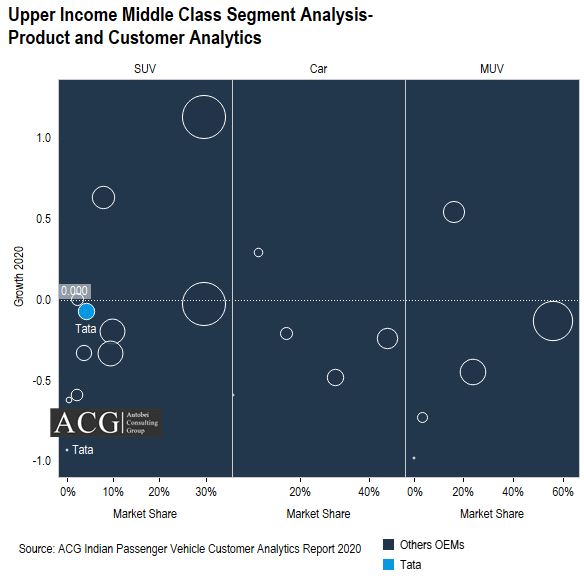
Upper Income Middle Class Segment Analysis-Product and Customer Analytics

Most of the customers of this income group still prefer Hyundai and Kia SUV brands. Tata Motors dominates over 5% market share and its relative market share increased from 12.8% to 14.7%. Harrier is playing a significant role in the customer journey. It brings customers to the point where they like the vehicle design, look, and style of the Harrier or Tata’s product range (Connect with Harrier). This induces them to buy and become curious to know about the other Tata’s products also. It is creating the base for 4 customer attributes: Benefits, Capabilities, Differentiation, and Value proposition. Now it is accelerating the other model sales like Tiago, and Nexon.

Current Scenario of Tata’s Product portfolio, and Position:

Each of these newly launched cars and SUVs within these segments is targeting a different group of income Group, Lifestyle, Age, and some are focused on family, some are focused on sporty, etc.

Tata Motor’s main point of difference within this group of competitors is its commitment to functional “Made in India” design at a relatively affordable price like Tata Harrier, Tata Nexon, Tata Tigor. Another reason is the aggressive sales team from dealers.
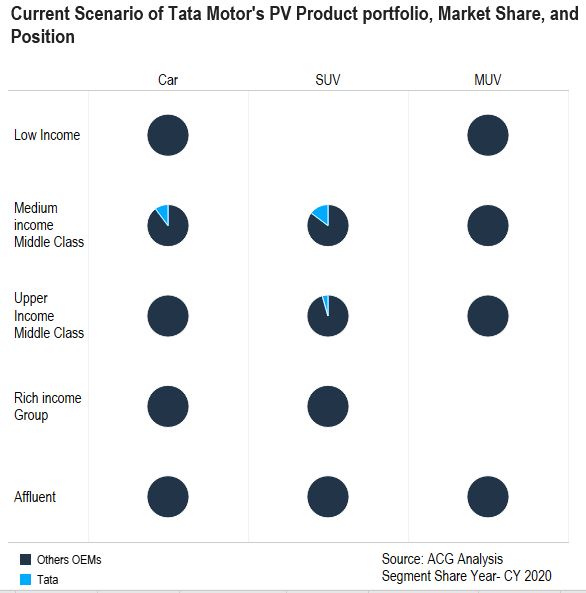
Current Scenario of Tata Motor's Product portfolio, Market Share, and Customer Analytics

We have surveyed to know “Why do you buy a Tata”? In most of the answers, the Model name supports the corporate brand Tata, like People, who love “Tata Harrier” design, Style, size, and features. As per our Survey, 67% of customers changed their steering from other brands to Tata Harrier.

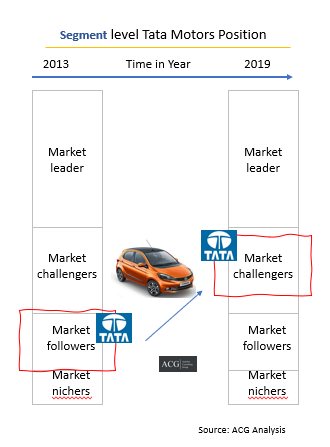
Tata Motor was not rated specifically high on any of the attributes in 2013, this implies a possible problem within the Product quality and the brand image and we saw the major changes in some of the attributes in 2021. This upgrade helps the Tata brand to gain double-digit market share in some specific segments.

Tata Punch launched Impact Analysis:
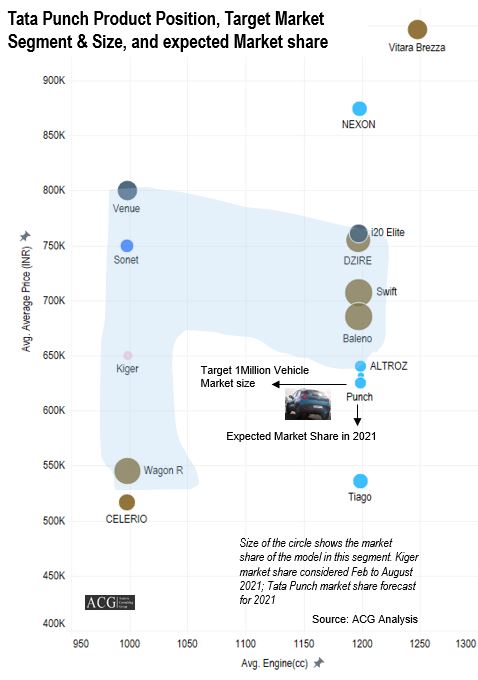
Tata Punch product position and its impact on Indian Car market

Tata Motor’s Commercial Vehicle Business Strategy:

A commercial vehicle is a different game with a variety of different rules, and it functions on various other measurable market dimensions. Tata Motor is also undertaking different market and product strategies for its Truck and Bus Business segment.
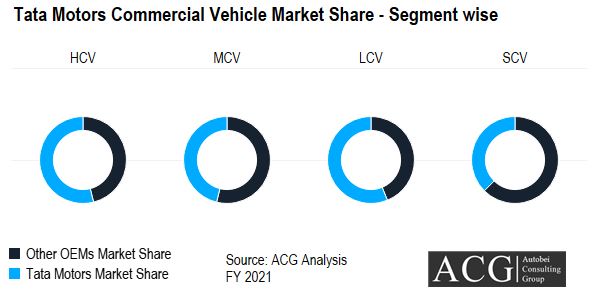
Tata Motors Commercial vehicle Segment wise Market share FY 2021

Tata Motors is a market leader in most of the Commercial Vehicle sub-segments. In the Overall CV segment, its market share is stagnant at around 42% from the last 5 years.

In the Truck Segment, Tata lost 1% market share, while in the Bus segment, its market share is almost stagnant. Under the CV segment, Tata Motors is continuously launching new products and upgrading the current product portfolio by adding new features.
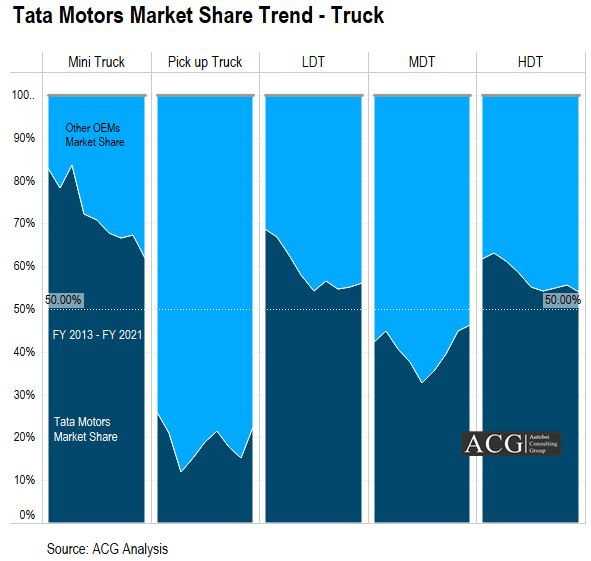
Tata Motors Truck Market Share Trend Analysis - Mini truck_Pickup truck_ Light duty truck_Medium Duty Truck_Heavy Duty truck market share

In Mini Truck, Tata ACE is one of the top-selling products from the very commencement of this segment. But now it is challenged by a new player in this segment—Maruti Suzuki’s Super carry. Due to its torque, it became the first choice for e-commerce application users.

There are two key competitors of Tata Motors in the Pickup segment, one is Mahindra and the other is Ashok Leyland which is very aggressive to gain market share in this segment. This is a growing segment in India. Customers are looking mainly for bigger vehicles for city-level applications.

LDT and MDT are smaller segments compared to Small trucks and Heavy Duty Trucks. Currently, in both segments, Tata Motors is in a dominant position. In Heavy Duty Truck Segment, Tata Motors has maintained more than 50% market share for over a decade. This is the segment where the company can upgrade the product features to increase the productivity of the drivers.

The company is the second-largest OEM in the Heavy Bus segment. Based on the different applications of the buses, Tata Motors needs to add new features to attract customers.
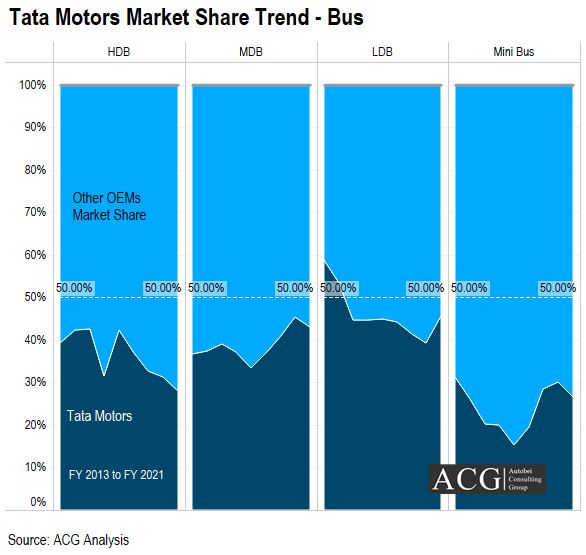
Tata Motors Market Share Trend Analysis Bus segment

There are some possibilities to increase the quality at an extra price. In this segment, the company could work on Electric Buses. Eicher Motors is targeting this segment by launching new products.Tata Motors Bus Market Segment Analysis
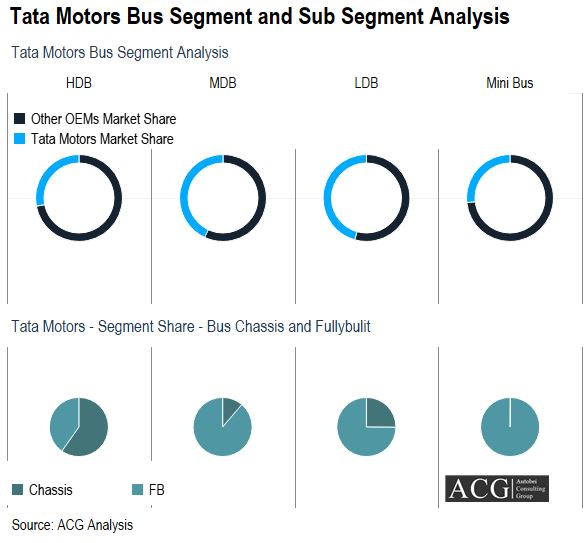
The Medium Duty Bus segment is dominated by both Tata and Eicher. Both are targeting a different segment. The light-duty bus segment is also dominated by Tata and Eicher. In this segment, the purchase criteria differ from those of heavy Duty Bus segment.

The Minibus segment has only one major player which is Force Motors with a 72% market share. The Traveller’s comfort driving features, the number of variants available, and its turning radius made it exercise control over this segment. Tata Motors tried hard to acquire the segment share but still, it is struggling even after some good products.

Contact Info@autobei.com to buy a full Report.

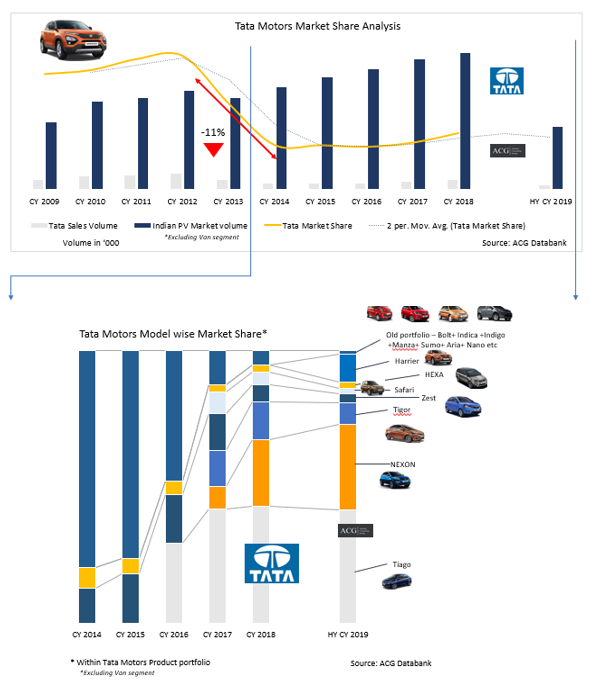
The Rise of Tata Motors Even After Losing Track is our detail report. The car market of India is necessarily become quite a competitive day by day. This can be clearly proved from the rise of Tata Motors even after it lost track between the years 2012 to 2014. In the year 2012, Tata Motors was in a commanding position in certain segments in the Indian car market with about 16 percent share of the market. In between the years 2012 to 2014, Tata Motors lost its grip in the segment of passenger vehicle and slipped down to about 5 percent market share from the commanding 16 percent. Some of the major reasons for the downfall so cited in this regard are poor product portfolio, changes in brand perception, and competitor position. These were some of the key reasons as to why the sales of Tata Motors went down in that period of time.

Tata Motors Car and SUV and Model level Market Share Analysis

With the launch of Tiago from Tata Motors in the year 2016, the company started to regain its lost reputation once again which marked the rise of Tata Motors even after is lost track for quite some time. The pricing, product specifications, and outstanding features were integrated into the car so as to target Indian middle-class buyers who would be using the vehicle for personal use and not for a taxi. Before this, a lot of Tata cars were predominantly going to taxi segments. Now, in spite of that, the same is not happening as Tata Motors have simply outperformed the market since the year 2016.

Most importantly, Tata Motors made a very smart move by promoting Tata Tiago and attracting the attention of the buyers by taking the football icon Lionel Messi. Tata Motors set an excellent example of how to change customer perception by changing its brand position by launching a new product range. Still, now, there is a very big opportunity for the company to increase the share of its market from seven to a whopping fifteen percent in the next three years of time.

Tata Motors Business Strategy

The product life cycle which is more popularly referred to as the PLC is the key behind the success of Tata Motors in the segment of the car as well as SUV. The top four models of the company are in the phase which is known as the ‘Growth in Product life cycle’.

The ‘Value Plus or Budget’ segment is the largest segment in the overall Indian car segment as per the ACG definition. The segment share of Tata Motors in ‘Value Plus’ segment is about 81 percent in CY 2018 within the Tata PV segment. Tata Motors as a company is still not present in a number of segments as well as sub-segments.

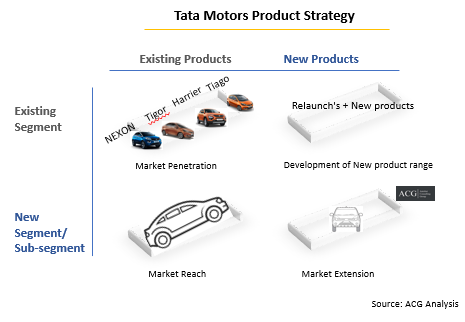
Tata Motors Product Strategy

ACG made an analysis of the success factor behind each and every model necessarily had its own USP. For example, the Harrier design is the first feature of the vehicle to take a call to find out more about the vehicle.

Harrier is in the premier SUV segment for the buyer who wants to upgrade their SUVs or cars. Brand loyalty and customer advocacy also play quite a vital role in the enhancement of its sales and performance. This is certainly going to be game-changer for the company. The company, Tata Motors has quite successfully changed its product image which is undoubtedly a great improvement from the perspective of the brand.

Most importantly, the dealers are also cracking deal with the aggressive strategy thereby enhancing the brand image of Tata Motors once again after it had lost track between the years 2012 to 2014. So, we have to just wait and watch what Tata Motors exactly does in the time to come.

Key Highlights of the Report:

  • Indian Car (PV) market size and Forecast
  • Tata Motors Sales and Market Share assessment study
  • Segment and Sub Segment Analysis
  • Tata Motors Product Portfolio and competitor Analysis
  • Car, SUV, and MUV product strategy
  • Product Price, Discount, Exchange schemes, Features, and Specs
  • Customer segment Analysis
  • Dealer performance
  • Challenges and Opportunities
  • GAP Analysis
  • Brand Image, Position, and Perception
  • Buying Journey of Tata Motors existing and Potential consumers
  • Marketing Strategy of Tata Motors
  • Advertising Analysis and its impact
  • How the company created value for its customers

Voice of Customer - Bus

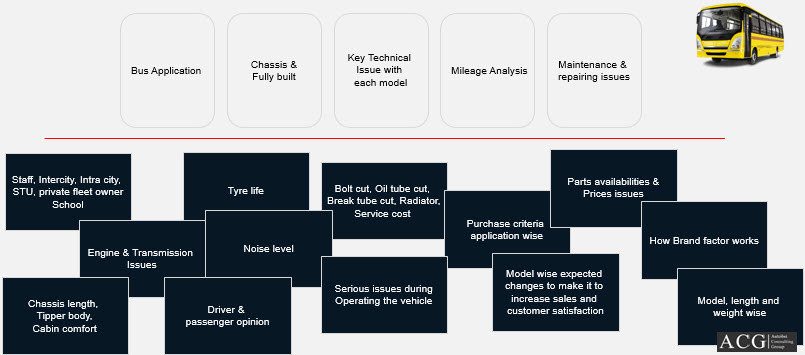
It is Exclusive analysis of customer voice on Bus product. We covered all technical issues, Bus USP, advantages, dis advantages, After sales support, products specifications feedback, customers pain area, Sitting comfort, Maintanance cost, TCO, Distance travel, Mileage, Speed, Safety features, Industry Issues and many other parameters.

Tata Motors, Ashok Leyland, SML Isuzu, Eicher, Volvo, Scania, Force Motors, Mahindra are inlcuded in our study. School Bus, STU, Intra city, Inter city, Staff, Ambulance are part of our study.

This report is beneficial for Product planning, Product position, Product portfolio, Product upgrade, Sales strategy review, Competitor product performace, Changes need to be done in product, Safety issues, Feedback from all stake holder and forecast.

The Commercial Vehicle Industry sales over the past year has been analysed and presented in this report. The overall sales have definitely seen growth from 2014 to 2015. 2015 has seen a 7% increase in sales of the commercial vehicle industry. Some companies have seen a stunning growth in sales whereas others have borne witness to a dilapidate fall in the same year. Overall however, this industry has managed to see a pleasant sales figure. The following figure shows the statistics for the brand wise market share and sales of commercial vehicles and their growth over the period from 2014 to 2015.

Commercial Market share 2015

Though Tata motors stands first in the race for market share, it has seen just a slight increase in sales corresponding to 1%. Their market share however favourable has dropped by 3% owing to the growth of several other companies in the same industry. Mahindra and Mahindra who were the runners up to Tata Motors have seen a reduction by 1 % in their sales. What may be most notable about these figures is the scenario of Ashok Leyland which has showed a stunning 40% growth in sales. Companies like Isuzu motors, Volvo, Eicher and Force motors are also characterized by increase in sales over the same year. Piaggio however has seen a staggering decrease in sales losing their already low market share to a mere 0.77%.

Quarter wise Sales Analysis:

Indian Commercial vehicle quarter wise analysis 2015

The Quarter wise analysis was able to point out to the following conclusions. The various quarters of the corresponding years 2014 and 2015 were analysed and this is what we found. Quarter one showed a slight 5% increase, while quarter 2 showed the minimum increase by 4% in sales. Quarters 3 and 4 however showed a huge increase sales corresponding to 10% and 11% respectively. Overall, the sales figures look good for this segment.

The company AMW was studied. The report first entails its change in sales which plots the percentage change in each quarter. The figures dont look too good for the company as the percentage change just seems to be going downhill from an already astoundingly low 35% in the first quarter. The percentage change in quarter 4 from 2014 to 2015 shows an excruciating drop to 79% decline in sales.

Linear to the sales figures, the market share for AMW motors shows a similar trend. Compared to the corresponding quarters in 2014, the 2015 quarters have shown a significant dilapidation owing to various factors. What can be said though is that this is a cumulative effect combining the effects of the first three quarters to drop to an all time low in the fourth quarter figures.

This company is in stark contrast to AMW and has seen a positive growth in sales from quarter 1 onwards. The highest ascent however was seen in the case of quarter 4 with more than 4% increase in market share. Overall this company has seen a positive growth.

The monthly sales figures of AMW motors for the year 2015 has been discussed in this report. The scenario in the case of AMW has not been a pretty one with sales dropping to a negative 0.08% gradually with the months. There was a slight increase in sales in the month of October, but it has been a dry year with sales only dwindling and not increasing by much during this year.

When the change in quarter is plotted, we can see that quarter 3 has seen some good figures of Ashok Leyland, however the other quarters have seen an increase, but not as much as the third quarter comparing the period from 2014 to 2015. This quarter wise analysis gives us better insight as to what goes into increasing the share and where it happened. Quarter 3 has seen as exorbitant 55% increase in sales over the year.

Ashok Leyland is one of the pioneers of the commercial vehicle industry and being one of the front runners of this segment, sales have indeed skyrocketed. The months of March and September have been exceptionally fruitful with a considerable increase in number of vehicles sold. The months following April untill August have seen stable sales with constant figures not increasing by much, however the year ended with a firework with more than 42% increase in sales by the end of December marking the beginning of a wonderful next year.

Force Motors first quarter analysis shows that it was a significant quarter which showed a good 17% increase in sales. Quarter 2 has seen a plummeting decrease in sales by 2%. However, this was a short-lived misfortune when the company rose to a 14% increase sales in the third quarter which rose to 16% in the successive quarter.

The market share of Force Motors in the current segment has revolved in and around 3%. All four quarters saw a slight increase in market share during the course of the past year, when analysed quarter wise.

Force motors saw it's prime time in April of 2015 where sales skyrockets and crossed the 3,000 units bar, far more than the sales figure of any other month last year. However, this celebration was short lived as it suffered yet another major loss of equivalent magnitude as it dwindled it's sales into the month of May. They were able to recover from the dwindling sales in the coming months and manage constant sales figures, but it never came to as high as in the month of April.

When the quarter wise percentage change is plotted against sales, we get an upward rising curve. This indicates that sales is rising with every quarter, the maximum being in the 4th quarter which saw almost a 17% increase in sales from the mere 14% descent in quarter 1 .

As the market share is assessed with every quarter change, a similar situation arises. Quarters 1,2 and 3 have seen around 2% increase in market share. The fourth quarter reveals that a market share as high as 27% is reached. However, the first quarter saw a major decrease of more than 5% from 2014 to 2015.

The market share of Piaggio mapped against each quarter from last year 2014 to 2015 is analysed in this report. This report shows that each quarter saw a decrease in market share from what it was in 2014 when compared with 2015. This change was especially significant in the fourth quarter when Piaggio almost 50% of its already low market share.

The sales curve shows a similar trend in comparison with each quarter. It began with Piaggio losing 9% of its sales in the first quarter over the course of one year from 2014 to 2015. Slowly however, it concluded with the fourth quarter showing a 25 % decrease in sales over the same period.

The first quarter saw a significant increase in sales of more than 50%. However, quarter 2's growth was mostly stable and it is characterized by what appears to be quite a flat curve. Quarter 3 saw a slight increase in market share. However, quarter 4 saw a slight decrease in market share. However, when we compare the market share for Quarter 1 in 2014 and 2015's quarter 4 market share it can be seen that not much has changed market share wise over the duration of one year.

The quarter wise analysis of the sales figures of SML Isuzu over the year has showed a chair shaped graph. Sales were at an all-time high in quarter 1. However, quarters 2,3 and 4 rang in synchronism with the market share graph and showed areas of either reduction or stable changes in sales.

Isuzu doesn’t have that big a market shares to boast about, but it definitely has increased with the passing quarter. Quarter 1 has seen more than 100% increase in market share over the duration of one year. So has Quarters 2 and 3. Quarter 4 has also seen a slight increase in market share. As far as quarter 4 is concerned, market share stands at a 0.18%.

The quarter wise sales graphs show an exasperated increase in quarter 1 sales figures over the year. Quarter 2 and 3 have also shown a significant increase in sales, though smaller than that of quarter 1. Quarter 4 on the other hand sees a minor increase of 46% in sales over the year.

The report encompasses the variation of sales of Tata motor vehicles with the passing of every quarter over the year from 2014 to 2015. A close look at the graph will yield a 5% increase in sales during the quarter 1 phase between 2014 and 2015. Quarters 2, 3 and 4 on the hand have shown either a very minor or almost no change in sales at all.

The Market share graphs are also not very appetizing. Though Tata motors owns this segment with almost 50% share of the market, this brand is slowly losing that value due to various reasons. Quarter 1 saw a very slight decrease in market share. Following that, the company has seen some major reductions in market share over the other quarters.

The graph of Sales versus quarter percentage change of this company over last year has been an increasing graph, boasting a 12% increase in quarter 1, slowly climbing to a 14% in both quarter 2 and 3 and steeping to an astounding 36% increase in sales of quarter 4.

Corresponding to the increase in sales, the market share of VECV Eicher has also increased to new heights in the fourth quarter over the past year. Quarters 1, 2 and 3 have also shown significant increase in market share over the year visible with the sales figures that were analysed previously.

Volvo has also seen increases in it's market share. However, it's market share is not as high as that of Eicher. Very similar percentages of increases in market share is seen over the quarters over the course of one year from 2014 to 2015. It's overall market share has however increased from a mere 0.10% in the first quarter of 2014 to more than 20% in the last quarter of 2015.

The sales curve also tells a similar story. The first quarter has shown a refreshing 54% increase in sales over the year, which has steeped to 40% in the second quarter and further plummeted to 28% in the successive quarter. It has managed to climb up to 34% in the last quarter.