Tag Archives: Indian Truck Market Analysis

Every Indian state is having different market dynamics like Market Size, Forecast, Vehicle Application, Brand position, Product position, Sales Outlook, Customer buying habits, Culture, Languages, Economy and vehicle requirements.

ACG State-wise Indian Commercial Vehicle Market Report is a detailed report which has been prepared with quantitative and qualitative data analysis.

Report Highlights:

  • Indian Commercial Vehicle Overview and Macro Economy Analysis
  • Commercial Vehicle Trend and Forecast – By Volume and By Value
  • Truck and Bus Segment
  • GVW-wise Sales Analysis
  • Model-wise/ Brand wise  Production and Sales
  • State-wise Volume and Market Share
  • State-wise GDP Analysis
  • Price and Discount Analysis
  • Key Drivers of the Industry
  • Application and Industry Analysis
  • Product Analysis
  • OEMs Strategy Analysis
  • Case Study: MAN, Scania, and Tata Prima Product
  • Driveline Analysis
  • New Technology Analysis and Forecast

Table of Contents:

  • Indian Commercial Vehicle Market Overview
    • Economy
    • Market Size
    • Segment and Sub-Segment Overview
    • Major players
    • Key Market Dynamics
  • Executive Summary
    • Key Findings
    • Segment Overview
    • Historical & Future Trend
    • Industry Drivers
    • Regulatory Factors
  • Research Scope, Objectives, Background, and Methodology
    • Research Scope
    • Research Objectives & Aims
    • Research Methodology
    • Research Background
    • Key Questions this Study Will Answer
    • OEM/Stake holders Covered in this Study
  • Product Segment Analysis: Goods & Passenger Vehicle
    • Small/Mini Commercial Vehicle Segment Analysis
      • By Units
      • By Worth (USD)
      • Segment growth analysis
      • New Product launched analysis and its impact
      • Segment Share analysis
      • Segment Driveline analysis
      • Price bracket
      • Product Application wise analysis
      • After sales & factor analysis
      • After Sales Strategy and Challenges
      • After Sales Commercial vehicle trend
      • Used vehicle market analysis
      • Trend Analysis
      • Buyers category
      • Segment Dynamics analysis
      • Forecast
    • Light Commercial Vehicle Segment Analysis
      • By Units
      • By Worth (USD)
      • Segment growth analysis
      • New Product launched analysis and its impact
      • Segment Share analysis
      • Segment Driveline analysis
      • Price bracket
      • Product Application wise analysis
      • After sales & factor analysis
      • After Sales Strategy and Challenges
      • After Sales Commercial vehicle trend
      • Used vehicle market analysis
      • Trend Analysis
      • Buyers category
      • Segment Dynamics analysis
      • Forecast
    • Medium Commercial vehicle
      • By Units
      • By Worth (USD)
      • Segment growth analysis
      • New Product launched analysis and its impact
      • Segment Share analysis
      • Segment Driveline analysis
      • Price bracket
      • Product Application wise analysis
      • After sales & factor analysis
      • After Sales Strategy and Challenges
      • After Sales Commercial vehicle trend
      • Used vehicle market analysis
      • Trend Analysis
      • Buyers category
      • Segment Dynamics analysis
      • Forecast
    • Heavy Commercial Vehicle
      • By Units
      • By Worth (USD)
      • Segment growth analysis
      • New Product launched analysis and its impact
      • Segment Share analysis
      • Segment Driveline analysis
      • Price bracket
      • Product Application wise analysis
      • After sales & factor analysis
      • After Sales Strategy and Challenges
      • After Sales Commercial vehicle trend
      • Used vehicle market analysis
      • Trend Analysis
      • Buyers category
      • Segment Dynamics analysis
      • Forecast
    • Commercial Vehicle Product Analysis
      • Product segment wise market size
      • Application wise Analysis
      • Product Price Analysis
      • Product Type wise
      • Category wise analysis
      • Engine Specs analysis
      • Transmission specs analysis
      • Fully built option
      • Chassis option
      • Cabin & Chassis option
      • CV Product Gap analysis
      • Product USP analysis
      • Product Life Cycle – major Models
      • Market dynamics
      • Mapping of Commercial vehicle application and model
  • Commercial Vehicle Vehicle Type:
    • Tipper
      • Product portfolio
      • Key Models
      • Technical Analysis
      • Price range
      • Application
      • Sales and Market share analysis
      • Competitive Analysis
      • After Sales Analysis
      • Customer profile
      • Buyers pattern
    • Rigid Haulage
      • Product portfolio
      • Key Models
      • Technical Analysis
      • Price range
      • Application
      • Sales and Market share analysis
      • Competitive Analysis
      • After Sales Analysis
      • Customer profile
      • Buyers pattern
    • Tractor – Long Haulage
      • Product portfolio
      • Key Models
      • Technical Analysis
      • Price range
      • Application
      • Sales and Market share analysis
      • Competitive Analysis
      • After Sales Analysis
      • Customer profile
      • Buyers pattern
    • Special or Customized Application
      • Product portfolio
      • Key Models
      • Technical Analysis
      • Price range
      • Application
      • Sales and Market share analysis
      • Competitive Analysis
      • After Sales Analysis
      • Customer profile
      • Buyers pattern
  • Customer Behaviour analysis
    • Psychology trend
    • Behavior parameter outlook
    • Product Trend Analysis
    • Customer Segment analysis
    • Commercial Vehicle buying factors
    • Customer Loyalty
  • CV Product Segment Analysis:
    • Low Budget Segment
      • Description of segment
      • Price range
      • Key Models analysis
      • Application & product analysis
      • Customer segment and key buying motivates
      • Segment Trend – Historical and Future
      • Segment dynamics analysis
    • Medium Budget
      • Description of segment
      • Price range
      • Key Models analysis
      • Application & product analysis
      • Customer segment and key buying motivates
      • Segment Trend – Historical and Future
      • Segment dynamics analysis
    • High Budget
      • Description of segment
      • Price range
      • Key Models analysis
      • Application & product analysis
      • Customer segment and key buying motivates
      • Segment Trend – Historical and Future
      • Segment dynamics analysis
    • Premium
      • Description of segment
      • Price range
      • Key Models analysis
      • Application & product analysis
      • Customer segment and key buying motivates
      • Segment Trend – Historical and Future
      • Segment dynamics analysis
  • Zone wise Commercial Vehicle Market Analysis
    • North Zone
      • Market size
      • Market Trend
      • Market forecast
      • Market dynamics
      • Market share
      • OEMs wise analysis
      • Major Application
      • Demand Analysis
      • Market Drivers
      • The Major States for Commercial Vehicle sales
      • Zone wise Customer behavior
    • South Zone
      • Market size
      • Market Trend
      • Market forecast
      • Market dynamics
      • Market share
      • OEMs wise analysis
      • Major Application
      • Demand Analysis
      • Market Drivers
      • The Major States for Commercial Vehicle sales
      • Zone wise Customer behavior
    • West Zone
      • Market size
      • Market Trend
      • Market forecast
      • Market dynamics
      • Market share
      • OEMs wise analysis
      • Major Application
      • Demand Analysis
      • Market Drivers
      • The Major States for Commercial Vehicle sales
      • Zone wise Customer behavior
    • East Zone
      • Market size
      • Market Trend
      • Market forecast
      • Market dynamics
      • Market share
      • OEMs wise analysis
      • Major Application
      • Demand Analysis
      • Market Drivers
      • The Major States for Commercial Vehicle sales
      • Zone wise Customer behavior
  • State wise Analysis
    • Karnataka
      • Market size
      • Market Forecast
      • Market Dynamics
      • State Macro Economy
      • Market Trend
      • Commercial Vehicle Application analysis
      • OEMs wise plotting against market dynamics
      • Sales Strategy
      • Top Players
      • Upcoming New Projects
      • Product and Segment category demand analysis
      • Network Analysis
      • State GDP
      • Key Industries
    • Andhra Pradesh
      • Market size
      • Market Forecast
      • Market Dynamics
      • State Macro Economy
      • Market Trend
      • Commercial Vehicle Application analysis
      • OEMs wise plotting against market dynamics
      • Sales Strategy
      • Top Players
      • Upcoming New Projects
      • Product and Segment category demand analysis
      • Network Analysis
      • State GDP
      • Key Industries
    • Tamilnadu
      • Market size
      • Market Forecast
      • Market Dynamics
      • State Macro Economy
      • Market Trend
      • Commercial Vehicle Application analysis
      • OEMs wise plotting against market dynamics
      • Sales Strategy
      • Top Players
      • Upcoming New Projects
      • Product and Segment category demand analysis
      • Network Analysis
      • State GDP
      • Key Industries
    • Kerela
      • Market size
      • Market Forecast
      • Market Dynamics
      • State Macro Economy
      • Market Trend
      • Commercial Vehicle Application analysis
      • OEMs wise plotting against market dynamics
      • Sales Strategy
      • Top Players
      • Upcoming New Projects
      • Product and Segment category demand analysis
      • Network Analysis
      • State GDP
      • Key Industries
    • Jharkhand
      • Market size
      • Market Forecast
      • Market Dynamics
      • State Macro Economy
      • Market Trend
      • Commercial Vehicle Application analysis
      • OEMs wise plotting against market dynamics
      • Sales Strategy
      • Top Players
      • Upcoming New Projects
      • Product and Segment category demand analysis
      • Network Analysis
      • State GDP
      • Key Industries
    • Madhya Pradesh
      • Market size
      • Market Forecast
      • Market Dynamics
      • State Macro Economy
      • Market Trend
      • Commercial Vehicle Application analysis
      • OEMs wise plotting against market dynamics
      • Sales Strategy
      • Top Players
      • Upcoming New Projects
      • Product and Segment category demand analysis
      • Network Analysis
      • State GDP
      • Key Industries
    • Uttar Pradesh
      • Market size
      • Market Forecast
      • Market Dynamics
      • State Macro Economy
      • Market Trend
      • Commercial Vehicle Application analysis
      • OEMs wise plotting against market dynamics
      • Sales Strategy
      • Top Players
      • Upcoming New Projects
      • Product and Segment category demand analysis
      • Network Analysis
      • State GDP
      • Key Industries
    • Himachal Pradesh
      • Market size
      • Market Forecast
      • Market Dynamics
      • State Macro Economy
      • Market Trend
      • Commercial Vehicle Application analysis
      • OEMs wise plotting against market dynamics
      • Sales Strategy
      • Top Players
      • Upcoming New Projects
      • Product and Segment category demand analysis
      • Network Analysis
      • State GDP
      • Key Industries
    • Delhi/NCR
      • Market size
      • Market Forecast
      • Market Dynamics
      • State Macro Economy
      • Market Trend
      • Commercial Vehicle Application analysis
      • OEMs wise plotting against market dynamics
      • Sales Strategy
      • Top Players
      • Upcoming New Projects
      • Product and Segment category demand analysis
      • Network Analysis
      • State GDP
      • Key Industries
    • Chhattisgarh
      • Market size
      • Market Forecast
      • Market Dynamics
      • State Macro Economy
      • Market Trend
      • Commercial Vehicle Application analysis
      • OEMs wise plotting against market dynamics
      • Sales Strategy
      • Top Players
      • Upcoming New Projects
      • Product and Segment category demand analysis
      • Network Analysis
      • State GDP
      • Key Industries
    • Rajasthan
      • Market size
      • Market Forecast
      • Market Dynamics
      • State Macro Economy
      • Market Trend
      • Commercial Vehicle Application analysis
      • OEMs wise plotting against market dynamics
      • Sales Strategy
      • Top Players
      • Upcoming New Projects
      • Product and Segment category demand analysis
      • Network Analysis
      • State GDP
      • Key Industries
    • Uttaranchal Pradesh
      • Market size
      • Market Forecast
      • Market Dynamics
      • State Macro Economy
      • Market Trend
      • Commercial Vehicle Application analysis
      • OEMs wise plotting against market dynamics
      • Sales Strategy
      • Top Players
      • Upcoming New Projects
      • Product and Segment category demand analysis
      • Network Analysis
      • State GDP
      • Key Industries
    • Jammu & Kashmir
      • Market size
      • Market Forecast
      • Market Dynamics
      • State Macro Economy
      • Market Trend
      • Commercial Vehicle Application analysis
      • OEMs wise plotting against market dynamics
      • Sales Strategy
      • Top Players
      • Upcoming New Projects
      • Product and Segment category demand analysis
      • Network Analysis
      • State GDP
      • Key Industries
    • Gujarat
      • Market size
      • Market Forecast
      • Market Dynamics
      • State Macro Economy
      • Market Trend
      • Commercial Vehicle Application analysis
      • OEMs wise plotting against market dynamics
      • Sales Strategy
      • Top Players
      • Upcoming New Projects
      • Product and Segment category demand analysis
      • Network Analysis
      • State GDP
      • Key Industries
    • Maharashtra
      • Market size
      • Market Forecast
      • Market Dynamics
      • State Macro Economy
      • Market Trend
      • Commercial Vehicle Application analysis
      • OEMs wise plotting against market dynamics
      • Sales Strategy
      • Top Players
      • Upcoming New Projects
      • Product and Segment category demand analysis
      • Network Analysis
      • State GDP
      • Key Industries
    • Orissa
      • Market size
      • Market Forecast
      • Market Dynamics
      • State Macro Economy
      • Market Trend
      • Commercial Vehicle Application analysis
      • OEMs wise plotting against market dynamics
      • Sales Strategy
      • Top Players
      • Upcoming New Projects
      • Product and Segment category demand analysis
      • Network Analysis
      • State GDP
      • Key Industries
    • Bihar
      • Market size
      • Market Forecast
      • Market Dynamics
      • State Macro Economy
      • Market Trend
      • Commercial Vehicle Application analysis
      • OEMs wise plotting against market dynamics
      • Sales Strategy
      • Top Players
      • Upcoming New Projects
      • Product and Segment category demand analysis
      • Network Analysis
      • State GDP
      • Key Industries
    • West Bengal
      • Market size
      • Market Forecast
      • Market Dynamics
      • State Macro Economy
      • Market Trend
      • Commercial Vehicle Application analysis
      • OEMs wise plotting against market dynamics
      • Sales Strategy
      • Top Players
      • Upcoming New Projects
      • Product and Segment category demand analysis
      • Network Analysis
      • State GDP
      • Key Industries
  • Pricing Trend Analysis: MRP & Discount Trend
    • Small Commercial Vehicle
    • Light Duty Commercial Vehicle
    • Medium Duty Commercial Vehicle
    • Heavy Duty Commercial Vehicle
    • Competitive price position of Tata, Ashok Leyland, BharatBenz, AMW, MAN, Piaggio, Force Motors, Mahindra, Volvo, Scania, SML Isuzu, Isuzu, Eicher
  • Business Environment
    • Major challenges
    • Opportunities
    • Global Impact
    • Business Sentiments
    • Political & Economy
    • FDI and Exchange rate
  • Major Export Market
    • OEM Analysis
    • Key Export markets
  • Application Industry Analysis
    • Construction
    • Road
    • Real Estate Development
    • Port
    • Mining
    • Logistics
    • E Commerce Industry and its impact on Commercial Vehicle Industry
    • Cement Industry
    • ODC
    • Light & heavy Machinery
    • Manufacturing Industry
    • Local Transport
  • Used Commercial Vehicle Analysis
    • Market size
    • Commercial and Technical challenges
    • Buying pattern
    • Trend Analysis
    • Business practice
    • Advantages
    • Disadvantages
    • Finance challenges
  • Advertising
    • Commercial Vehicle Industry traditional way
    • Most effective ad strategy
    • Competitor Ad strategy
    • Print
    • Electronic
    • TV Commercial
    • Digital
  • Company Analysis
    • Tata Motors
      • Latest Developments
      • Product portfolio
      • Product age
      • Product life cycle
      • Application analysis
      • Strategy
      • Segment Analysis
      • Customer profile
      • Brand perception
      • USP
      • Key persons
    • Ashok Leyland
      • Latest Developments
      • Product portfolio
      • Product age
      • Product life cycle
      • Application analysis
      • Strategy
      • Segment Analysis
      • Customer profile
      • Brand perception
      • USP
      • Key persons
    • Eicher Motor
      • Latest Developments
      • Product portfolio
      • Product age
      • Product life cycle
      • Application analysis
      • Strategy
      • Segment Analysis
      • Customer profile
      • Brand perception
      • USP
      • Key persons
    • Volvo
      • Latest Developments
      • Product portfolio
      • Product age
      • Product life cycle
      • Application analysis
      • Strategy
      • Segment Analysis
      • Customer profile
      • Brand perception
      • USP
      • Key persons
    • Scania
      • Latest Developments
      • Product portfolio
      • Product age
      • Product life cycle
      • Application analysis
      • Strategy
      • Segment Analysis
      • Customer profile
      • Brand perception
      • USP
      • Key persons
    • Force Motors
      • Latest Developments
      • Product portfolio
      • Product age
      • Product life cycle
      • Application analysis
      • Strategy
      • Segment Analysis
      • Customer profile
      • Brand perception
      • USP
      • Key persons
    • Piaggio
      • Latest Developments
      • Product portfolio
      • Product age
      • Product life cycle
      • Application analysis
      • Strategy
      • Segment Analysis
      • Customer profile
      • Brand perception
      • USP
      • Key persons
    • Mahindra
      • Latest Developments
      • Product portfolio
      • Product age
      • Product life cycle
      • Application analysis
      • Strategy
      • Segment Analysis
      • Customer profile
      • Brand perception
      • USP
      • Key persons
    • Daimler India Commercial Vehicle (DICV)
      • Latest Developments
      • Product portfolio
      • Product age
      • Product life cycle
      • Application analysis
      • Strategy
      • Segment Analysis
      • Customer profile
      • Brand perception
      • USP
      • Key persons
    • Isuzu Motors
      • Latest Developments
      • Product portfolio
      • Product age
      • Product life cycle
      • Application analysis
      • Strategy
      • Segment Analysis
      • Customer profile
      • Brand perception
      • USP
      • Key persons
    • SML Isuzu
      • Latest Developments
      • Product portfolio
      • Product age
      • Product life cycle
      • Application analysis
      • Strategy
      • Segment Analysis
      • Customer profile
      • Brand perception
      • USP
      • Key persons

The can be customize as per the requirement. Every time, updated version of the report is available along with Excel and Power Point version.

Tata Group is an iconic brand based out of India. The Tata brand is respected and trusted worldwide.

Tata Motor Automotive business is primarily divided into two main categories:

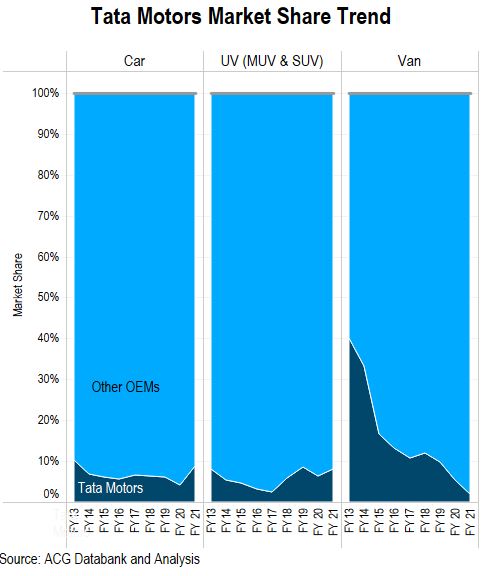
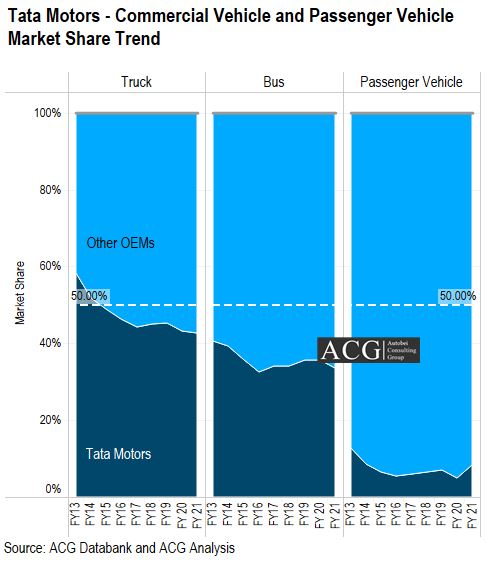
In the last few years, Tata Motors experienced losing its grip on some of the automotive segments and sub-segments of Cars,  Trucks, and Buses.

Tata Motors Commercial Vehicle and Passenger Vehicle Market Share Trend Analysis

Tata Motors increased its market share by launching a new product range in the SUV and Car Segment.

Tata Motors Car SUV and MUV Market Share Trend Analysis

There are basically five main components a business relies on:

  • Brand Experience, perception or image
  • Customer’s consideration to Trust, like, and buy it
  • Customer Satisfaction
  • Rich Products portfolio,..no but the suitability of product as per customer needs, demands, and expectation

Tata Motors greatly started to focus on its Product range, Price point, Features, Design, Style, Customer segment, and Dealer involvement.

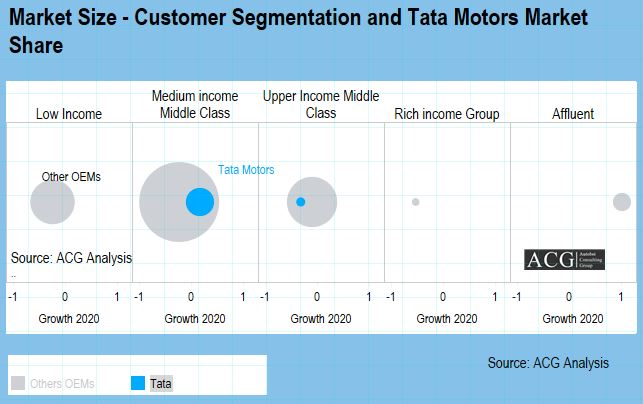
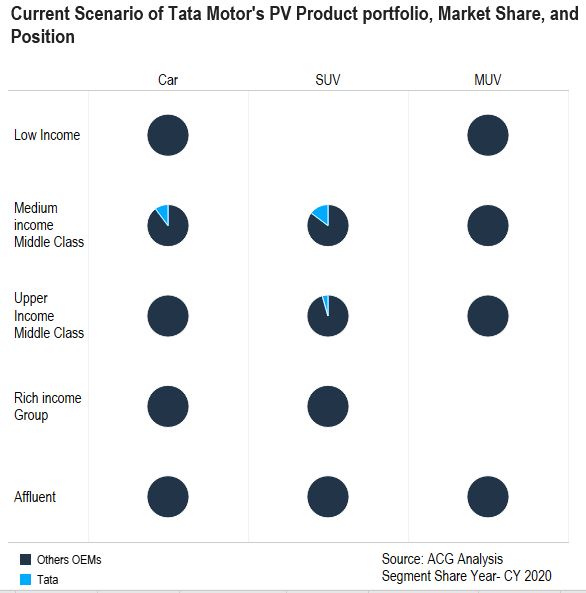
Tata Motors, a company formally known to have established an offering of affordable product range, appears to have been drifting away from that image. The company now manufactures vehicles for ValuePlus, Premium, and High-end segments in the passenger Vehicle category for medium Middle, Upper Middle Class, and Affluent income classes. There is no product available for lower and Elite class income class.  Launching new models for these two income group customers could increase Tata Motor’s market share by 5 to 7%.

Market Size - Customer Segmentation Analytics and Tata Motors Market Share

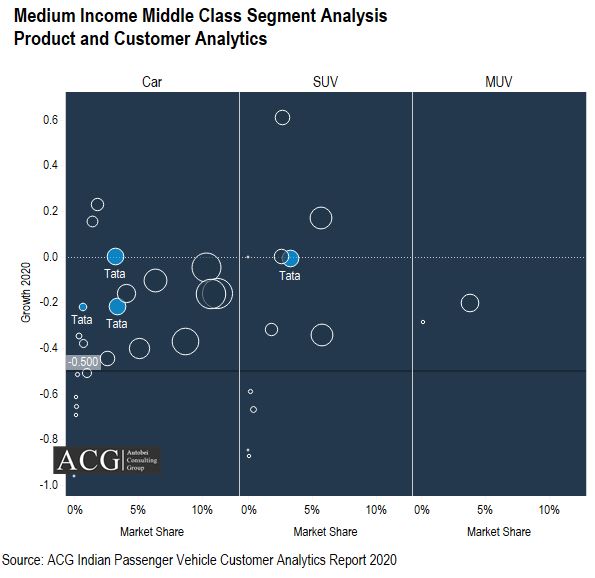
The Medium income Middle-class customer segment owns 67% of sales of cars, SUVs, and MUV shares and is one of the most significant segments in the Indian PV segment. At present, Maruti regulates this segment with 12 models while Tata has only 4 models.

Medium Income Middle Class Segment Analysis- Product and Customer Analytics

In this segment, the Relative market share of Tata Motors climbed from 11 to 17.5% between 2017 to 2020. However, Tata remains the second-best performer in this segment by increasing 6% relative market share with just 4 models.

Tata Motors Segment, Product, and Market Analysis: Upper Income Middle-Class Group:

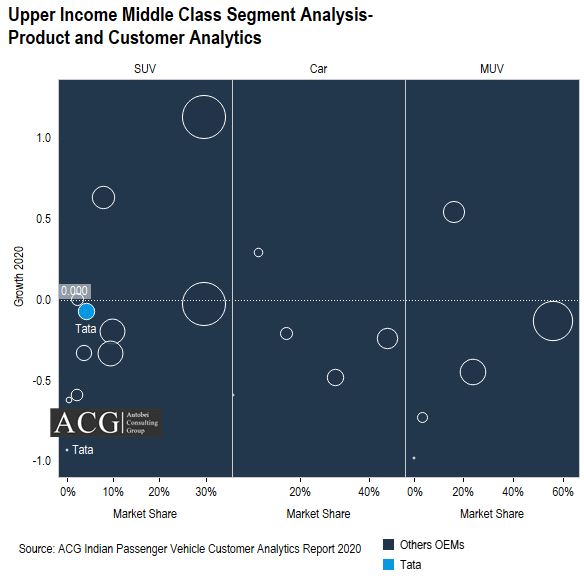
The Upper-income Middle-class group customer contributed 11% segment share in Tata Motors SUV Sales in 2020 as per ACG Customer Analytics Report 2021.

Upper Income Middle Class Segment Analysis-Product and Customer Analytics

Most of the customers of this income group still prefer Hyundai and Kia SUV brands. Tata Motors dominates over 5% market share and its relative market share increased from 12.8% to 14.7%. Harrier is playing a significant role in the customer journey. It brings customers to the point where they like the vehicle design, look, and style of the Harrier or Tata’s product range (Connect with Harrier). This induces them to buy and become curious to know about the other Tata’s products also. It is creating the base for 4 customer attributes: Benefits, Capabilities, Differentiation, and Value proposition. Now it is accelerating the other model sales like Tiago, and Nexon.

Current Scenario of Tata’s Product portfolio, and Position:

Each of these newly launched cars and SUVs within these segments is targeting a different group of income Group, Lifestyle, Age, and some are focused on family, some are focused on sporty, etc.

Tata Motor’s main point of difference within this group of competitors is its commitment to functional “Made in India” design at a relatively affordable price like Tata Harrier, Tata Nexon, Tata Tigor. Another reason is the aggressive sales team from dealers.

Current Scenario of Tata Motor's Product portfolio, Market Share, and Customer Analytics

We have surveyed to know “Why do you buy a Tata”? In most of the answers, the Model name supports the corporate brand Tata, like People, who love “Tata Harrier” design, Style, size, and features. As per our Survey, 67% of customers changed their steering from other brands to Tata Harrier.

Tata Motor was not rated specifically high on any of the attributes in 2013, this implies a possible problem within the Product quality and the brand image and we saw the major changes in some of the attributes in 2021. This upgrade helps the Tata brand to gain double-digit market share in some specific segments.

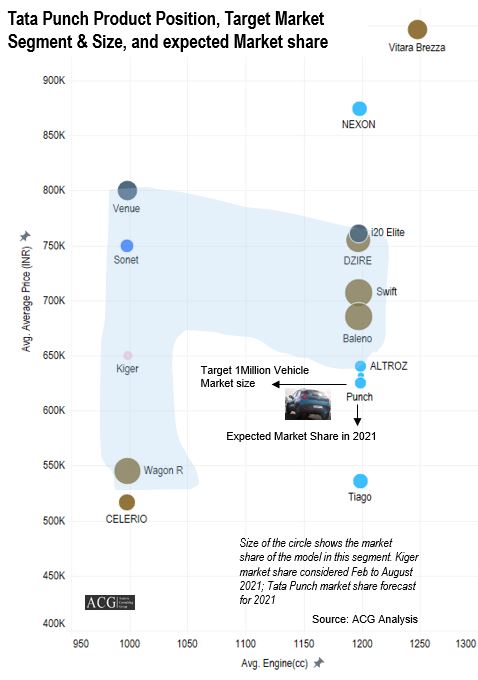
Tata Punch launched Impact Analysis:

Tata Punch product position and its impact on Indian Car market

Tata Motor’s Commercial Vehicle Business Strategy:

A commercial vehicle is a different game with a variety of different rules, and it functions on various other measurable market dimensions. Tata Motor is also undertaking different market and product strategies for its Truck and Bus Business segment.

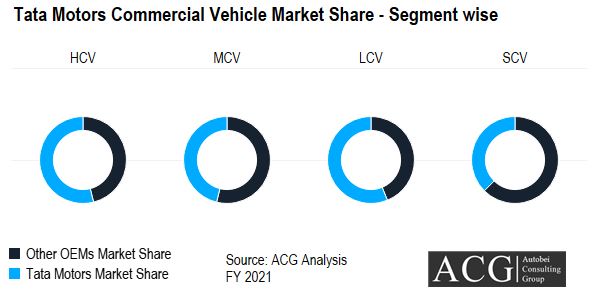
Tata Motors Commercial vehicle Segment wise Market share FY 2021

Tata Motors is a market leader in most of the Commercial Vehicle sub-segments. In the Overall CV segment, its market share is stagnant at around 42% from the last 5 years.

In the Truck Segment, Tata lost 1% market share, while in the Bus segment, its market share is almost stagnant. Under the CV segment, Tata Motors is continuously launching new products and upgrading the current product portfolio by adding new features.

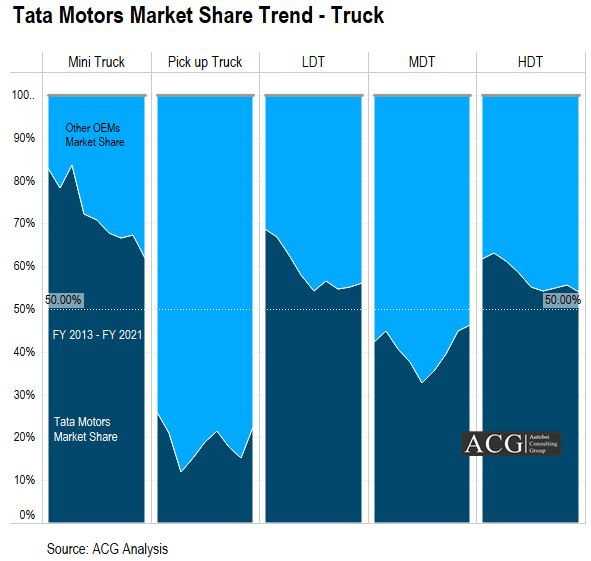
Tata Motors Truck Market Share Trend Analysis - Mini truck_Pickup truck_ Light duty truck_Medium Duty Truck_Heavy Duty truck market share

In Mini Truck, Tata ACE is one of the top-selling products from the very commencement of this segment. But now it is challenged by a new player in this segment—Maruti Suzuki’s Super carry. Due to its torque, it became the first choice for e-commerce application users.

There are two key competitors of Tata Motors in the Pickup segment, one is Mahindra and the other is Ashok Leyland which is very aggressive to gain market share in this segment. This is a growing segment in India. Customers are looking mainly for bigger vehicles for city-level applications.

LDT and MDT are smaller segments compared to Small trucks and Heavy Duty Trucks. Currently, in both segments, Tata Motors is in a dominant position. In Heavy Duty Truck Segment, Tata Motors has maintained more than 50% market share for over a decade. This is the segment where the company can upgrade the product features to increase the productivity of the drivers.

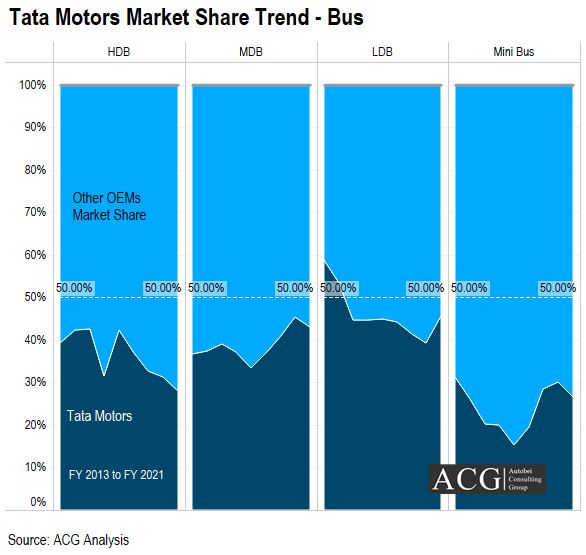
The company is the second-largest OEM in the Heavy Bus segment. Based on the different applications of the buses, Tata Motors needs to add new features to attract customers.

Tata Motors Market Share Trend Analysis Bus segment

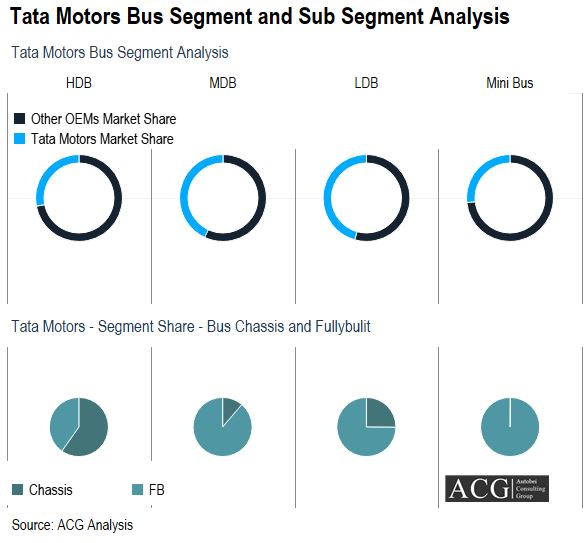
There are some possibilities to increase the quality at an extra price. In this segment, the company could work on Electric Buses. Eicher Motors is targeting this segment by launching new products.Tata Motors Bus Market Segment Analysis

The Medium Duty Bus segment is dominated by both Tata and Eicher. Both are targeting a different segment. The light-duty bus segment is also dominated by Tata and Eicher. In this segment, the purchase criteria differ from those of heavy Duty Bus segment.

The Minibus segment has only one major player which is Force Motors with a 72% market share. The Traveller’s comfort driving features, the number of variants available, and its turning radius made it exercise control over this segment. Tata Motors tried hard to acquire the segment share but still, it is struggling even after some good products.

Contact Info@autobei.com to buy a full Report.

ACG expects that Indian Heavy Duty Truck Market started to register growth in the third quarter of CY 2021. The latest development of the construction, Mining Industry, and manufacturing expected growth prepare some ground to support the Tipper segment and Tractor segment.

Key highlights of the report:

  • Pan Indian and State level Volume forecast
  • Truck Type – GVW and body type
  • Premium, Budget segment Analysis – Key Products, Market share, USP, etc
  • Challenges and Opportunities
  • OEM Strategy Analysis
  • Customer insight – Their sales plan for next year
  • Coal, limestone, Iron ore, OB, Real estate, Logistic, and Infrastructure Construction
  • Tender Analysis
  • Mapping Customer / Project for Truck sales
  • Other Equipment like new, imported, Lease, Rental, and used
  • Equipment fleet operators
  • Business Operations of fleet operators
  • AMC offering by OEMs
  • Replacement cycle
  • Truck age based on uses and type
  • Vehicle prices and discount
  • Running or coming up the project – Project size, Ownership, types of project
  • Fleet portfolio of Contractor
  • States of mines and the required number of the vehicle for operation
  • Key strategic contractors/customers

Autobei Consulting Group has done various strategic projects on Indian Truck Transport sector or Truck Fleet owners/ Drivers since 2011. ACG always check the pulse of the Indian Truck Industry through various stakeholders of the Industry like Driver survey, Fleet owner survey, Truck ownership pattern, Future trend and other keys issues. 

  • Fleet Owner Operation practice
  • Revenue Model
  • Purchase pattern of Vehicle, Spare parts, and other services & products
  • Driver detail database
  • Planning to buy a new vehicle
  • Repairing vehicle – Workshop 
  • Vehicle leasing and rental concept
  • Transporters expectation
  • Transporters Challenges
  • Adaptation of Digital solution
  • Mapping Truck Best Application
  • Used Truck Sales
  • Load and unloading issues

Another part of the database:

  • OEM and Model name
  • Year of Manufacturing
  • Year of registration
  • GVW
  • Payload
  • Truck Type – Tipper, ODC, Tractor, Special Application etc
  • Axle configuration
  • Engine Make
  • Engine Power
  • VIN
  • Steering Type
  • Country of manufacturing
  • Chassis detail
  • Body Type
  • Owner name
  • Truck Application
  • Address and Contact number

We have released Sales and Production forecast data of Indian Truck market. The forecast data defined in the following category:

  • Total Commercial Vehicle Trend and Forecast 2030
  • GVW/Tonnage basis
  • Mini, Pick up, LDT, MDT, and HDT
  • Axle type based
  • Vehicle Type: Haulage( Box type, Open, refrigerated etc.), Tipper (Construction, Mining, Tunnel operation),  Special Application (Municipal, Tanker, Fire, Transit mixer), Trailers (Flat Bed, Semi Trailer, ODC etc)
  • OEM (Tata, Ashok Leyland, BharatBenz, SML Isuzu, Swaraj, VECV Eicher, VECV Volvo, Scania, Mahindra) and Model wise breakup
  • City, State, and region wise Data
  • Other useful information like Market Size, Pricing, Engine, Transmission detail, Export Opportunities
  • Market Dynamics
  • Consumer Demand Analysis
  • Competitive Dynamics
  • Market Trend Analysis
  • Truck Fleet owner data based on Fleet size
  • Brand Position and Strength
  • Another data is Model wise Production data Trend and Forecast 2030
  • Key specs of Model
  • Company profile of OEMs

The data is useful for 

  • Future strategy
  • Market and segment trend analysis
  • Competition scenario

The data is available in Excel and ACG Analytics software.

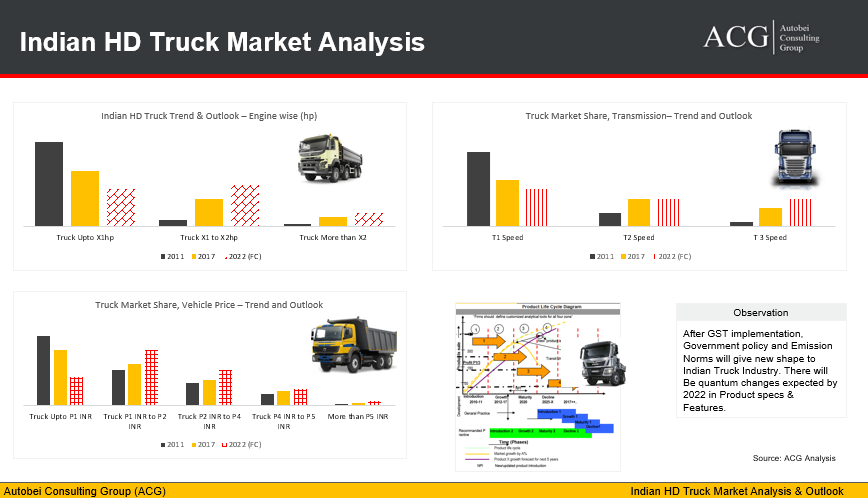
Indian Heavy Duty Truck Market Analysis is our latest Market Intelligence and Strategy Report.

The Economic Survey 2018 has estimated that the Indian economy will grow by 7-7.5% in 2018-19. It is expected to be the fastest growing economy in the world. The key growth drivers are the rollout of a nationwide Goods and Services Tax (GST) and the post-impact demonetization in November 2016. Oil price is the short-term challenge for expected growth in GDP. It is projected that a $10 per barrel increase in the price of oil cuts growth by 0.2 to 0.3 percent.

E- way bill is also going to change the Indian logistic Industry. It is fully electronic paperless, It give access to faster movement of goods, Reduces time at the check post, Number of trips of trucks has been increased, Reduce operating vehicle cost, and Increase Product lifecycle. With improving infrastructure the speed of the trucks increased from 30 to 40% and higher tonnage truck is in demand which reflects in more productivity of trucks.

OEMs need to innovate products which would match the fleet owners demand and match with their business model along with the introduction of advanced technology. ACG interact with fleet owners regularly to forecast the demand analysis of Trucks, this is exclusive methodology which draws a realistic picture of future Truck Industry.

Indian HD Truck Market Analysis and Outlook

Report Highlights:

  • Indian Heavy Duty Truck Overview
  • OEM Brand wise Sales and Market share
  • OEM Critical Strategy and Product Analysis
  • Segment wise Sales and Production Outlook
  • Model level Truck Sales and Production Forecast
  • Engine wise Market size and Market share of OEMs
  • OEM presence in Engine power segment bracket
  • Market size based on Transmission – Number of Speed & Type of Transmission
  • GVW Sub Segment Product and Market Analysis 16.2T, 25T, 31T, 49T and others
  • Fleet owners buying plan for trucks
  • Popular variants of Models  – CBC, FBT, Cowl etc
  • Product up gradation Analysis – Tata Signa, PRO, Captain and other Models
  • Model-wise Product USP and product pain area
  • Model-wise Most suitable Truck Application
  • Truck Fleet owner and Driver survey on various issues
  • Product platform Analysis and Product Concept
  • Network Analysis


ACG forecast knowledge center released latest data on Global Bus Production Model wise Trend and Forecast. The database gives you access to critical information of more than 40 markets, more than 150 Bus (OE)/body and 75 Engine manufacturers detail. The database is designed based on Brand and Model name level. 

The following information is included in Bus database:

  • Global Bus Market overview
  • Historical market Trend since 2001 to forecast 2025
  • Regional Market Trend
  • Global Market share and Growth
  • Top OEMs and their Market Share
  • Country wise Top Bus Models and Technical Specs
  • Region wise Top Bus Models and Technical Specs
  • GVW  wise Bus Analysis
  • Bus Type Vehicle to Market Mapping
  • Assembly type – Full or CKD kit
  • Product Platform wise Analysis
  • Bus Lifecycle (Model wise)

Application wise Analysis – Country & Global:

  • Bus Frame
  • Intercity
  • City Bus
  • Micro Bus
  • Others

Technical Bus Data :

  • Propulsion system wise
  • Engine wise
  • Emission wise
  • Engine Horsepower wise
  • Torque horsepower wise

Bus Manufacturing Plant:

  • Plant location
  • Capacity
  • Brand/Model name Production  

Fuel Type Bus Analysis

  • Diesel
  • Electricity
  • CNG LNG Type
  • Gas
  • LPG
  • Mix

Country wise, Brand wise and Region wise data is also available 

Region: Europe, Greater China, Japan, Korea, Middle East, Africa, North America, South America and South Asia.

Countries: Austria, Belarus, Belgium, India, Czech Republic, Estonia, Finland, France, Germany, Hungary, Ireland, Italy, Kazakhstan, Lithuania, Netherlands, Poland, Portugal, Romania , Russia, Slovakia, Spain, Sweden, Turkey, Ukraine, United Kingdom, Uzbekistan, China, Taiwan, Japan, South Korea, Iran, South Africa, Canada, Mexico, United States, Argentina,  Brazil, Colombia, Ecuador, Peru, Venezuela, Australia, India, Indonesia, Malaysia, Pakistan, Philippines and Thailand.

Taiwan Commercial Vehicle Production Forecast is the detailed database of M&HCV vehicle forecast units and Technical detail. ACG Forecast unit released Model & Brand wise latest forecast report on Taiwan Truck and Bus segment. The Trend is available since 2001 to 2025. There is the separate database for Truck and Bus segment. Along with Data forecast, we also map the key technical detail of each model. Database includes Product Architecture, Design concept, Start and End of Production of vehicle model and Engine Model, What type of Assembly, Product Platform, Engine detail like power, Torque, Fuel type, Emission norms, Engine Displacement, Engine valve and Cylinder detail, GVW detail, Plant detail, Sales Distribution, Plant capacity and other key details.

The database is a useful for product planning, Product strategy, New Investment decision, the Blue print of Business planning, Recruitment decision etc.


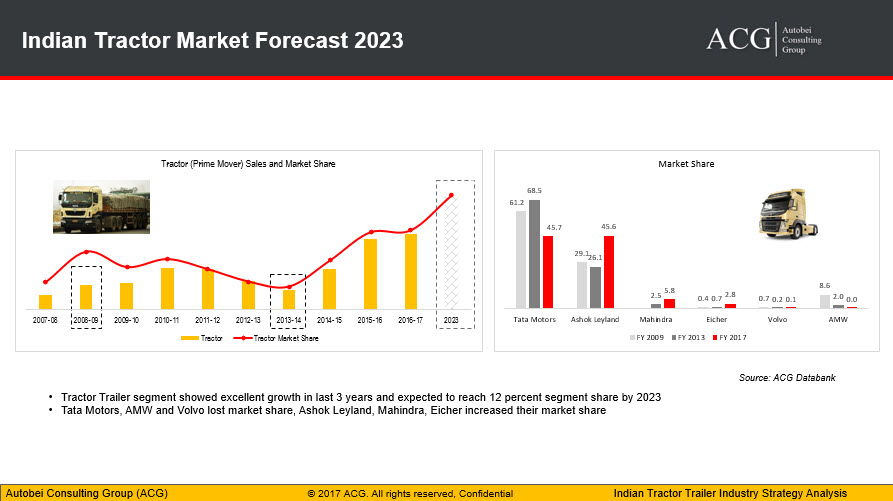
Indian Tractor Trailer Strategy Analysis and Forecast is our exclusive detail report. Indian Tractor Trailer market is flourishing in India. It has a registered impressive growth in last 3 years. This segment will gain quantum advantages of GST implementation and this is one of the biggest fiscal reforms since independence. It is the right time to enter into the Tractor business or launch new product/ Update existing product portfolio. The segment is divided into Low cost, Budget, and Premium segment.

(Subscription our Annual service package and get unlimited exclusive reports)

From 2013 to 2017, the CAGR of the segment was 27.9 percent and now, it is expected to 7.9 percent by 2023.

The market size has become more than double in last 10 years. The market size was around 25,000 units in FY 2008 and it is 53,000 units in FY 2017.

Indian Tractor Trailer Market Trend and Forecast

Tata Motors and Ashok Leyland are having an almost equal market share, however, Ashok Leyland gained 19.5 percent market share and on the other hand, Tata Motors lost 22.8 percent, Mahindra and Eicher gained 3.3 percent, Volvo and AMW lost 0.1 percent and 2 percent market share.

There is nothing called good or bad tractor, but it all depends on its application. The Tractor is suitable for many long-distance loads carrying, special application and heavy loads transportation. Some of the Applications are Agriculture, ODC, Space, Defence, Vehicle transportation, Gas, Machinery high-density material, coal, Construction Material, Machinery, Steel, Container, Bulker, ODC, Marbles, Tanker etc.

Every state is having different market dynamics, Market Size, Growth Driver, Opportunities, and Challenges. Our full report covered a very critical analysis of this segment.

It covers the long distance, after-sales, Driver comfort, Safety features, Cabin size, Mileage, payload, and Speed plays a vital role. 

The market trend is moving from low cost to Budget segment, most of the products already moved but the premium segment is stagnant.

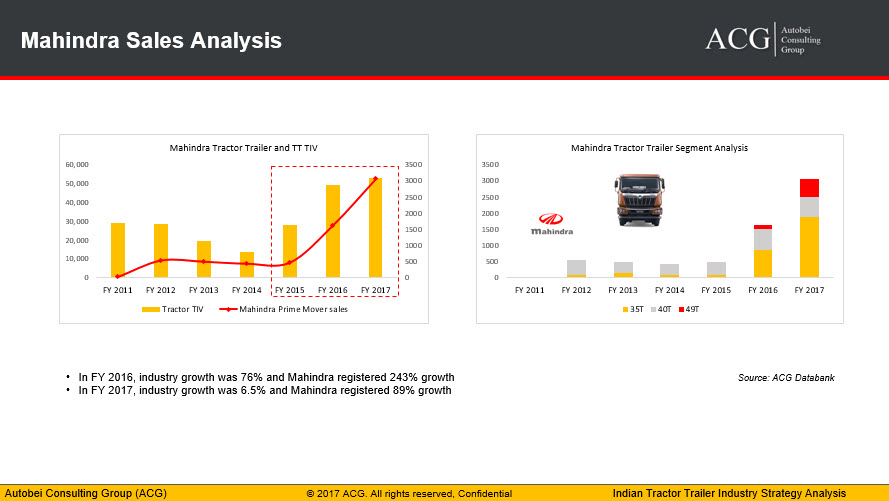
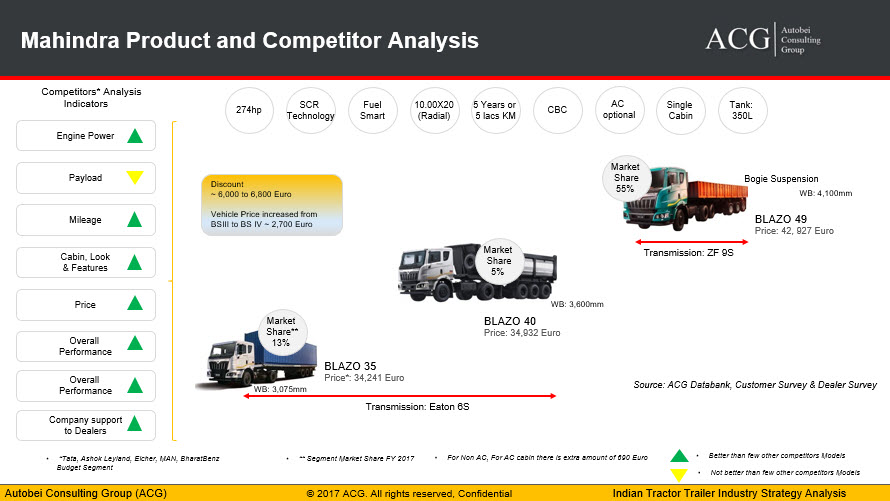
Mahindra Blazo performance is an excellent and its mileage challenge looks work to gain customers confidence. Mileage is one of the most important criteria for tractor vehicle. The Tractor sales increased from 500 units to 3,075 units in FY 2017.

Mahindra Truck Sales Analysis

Mahindra Product and Sales Analysis:

Mahindra Product and Competitor Analysis

On our detail report, we have analyzed what are the reasons for this market share fluctuation.

We have analyzed in brief that the great impact of GST is overloading banned, improve road infrastructure, logistic sector growth, Elimination of the checkpoint, Lower turnaround time, Expected changes in Supply chain changes, E-way bills, Fleet Utilization etc.


The truck industry has been analysed segment wise and divided into segments for better clarity of the sales figures. The truck segment is characterized into the SCVs, LCVs, MCVs and HCVs. The maximized growth of trucks was seen in the SCV segment which shows a varying graph of sales over the year with quarter wise witnessing the maximum growth. This was followed by the sales of the HCVs. 

Indian truck market report 2015

The least sales was observed in the LCV and MCV segments.

The market share varies in accordance with the sales figures with SCVs at the head of the table and the MCVs and LCVs at the end of the table. SCVs dictate more than half the market with segment share varying as a function of sales. HCVs on the other hand are the runners up with an average of 25% throughout the year. Through the year however, the segment share shows erratic behaviour with ups and downs which vary with every quarter.

The report also entails a detailed analysis of the sales of each brand to give us a better insight into the internal working of the industry. Tata Motors are the pioneers of the industry with an outstanding 48% market share which dipped down by 2 % in the subsequent year. However they still retain their position as the dictators of this segment. M & M are the runners up, though they constitute only about one-fourth of this segment. Their segment shares also suffered a minor loss in sales as the years progressed. In stark contrast, Ashok Leyland rose up the scales in terms of market share as well as sales. Their sales were characterised by a 39% increase, leading to a corresponding increase in market share too. Companies like Piaggio, Force Motors and AMW however were impacted by a major degradation in sales translating to a decline of more than 21% in sales. Their minimal share was also downtrodden.

Irrespective of industry, brand and segment it has come to observation that the sales and market share figures have always shown a linear change. These two are linearly proportional to each other and the graphs of each company showcase just the same. AMW has seen a stunning decrease in both market share as well as sales figures when the corresponding figures for each quarter through the year are analysed side by side. Though their market share was not much to boast about to start with, these minimal figures have also degraded ostensibly over the year through the various quarters.

To gather a better understanding of the same, the monthly sales have been analysed with the months of January, February and March showing the maximum sales and the subsequent months portraying a steady descent ending with almost negligible sales in the month of December.

One of the companies which have had a refreshing increase in sales have been Ashok Leyland.  Each quarter has seen more than 20% increase in sales and atleast a 3% increase in market share over the past year.

When it’s monthly sales have been analysed, we see a varying graph with periods of increase followed by periods of decline in sales with the months of March, July, August, September and December witnessing positive growth while on the other hand the months of April, October and November have suffered a huge decline in their sales figures.

Tata Motors have maintained their position as pioneers of this segment. They dictate the truck industry bagging almost 50% of the market. Sales have seen minor decline and elevation now and then over the various quarter through the year. On the whole, this company has seen only increases in their sales figures, owing to a fruitful segment share in the market. Though each quarter has seen a decline in market share percentage, they have still managed to ensure that the sales stay at the top and does not fall below a stipulated level.

The monthly sales trends of Tata Motors mainly show growth. Few exceptions lie in the month of April and November when negative growth was seen, but this was quickly rectified with a speedy ascent in sales the subsequent month.  The months of March and September showed an exceptionally elevated increase in sales.

VECV does not have more than a 5% market share to boast. Yet, each corresponding quarter of the previous year has seen atleast a slight increase in sales, owing to an increase in market share by almost 1%.

The monthly sales figures mainly show growth over the years. The exceptional months of April and November show slight decrease in sales, which spring right back up in the upcoming months. March and December however showed exceedingly elated increase in sales.

Mahindra stands at number 2 in the truck industry competition. Though its market share comes nowhere close to Tata Motors, this industry has thrived in well in the individual quarters over the year. Quarters 1 and 2 showed negative growth with plummeting figures whereas Quarters 3 and 4 have witnessed tremendous growth in terms of sales as well as market share percentage.

The monthly sales of Mahindra have majorly seen positive growth through the year with the exceptionally high sales months being October and March. On the other hand, some months have also witnessed plummeting descents of more than 21% characterized by the months of April and November.

In terms of sales, quarter 1 has seen a slight decrease in sales owing to a 0.14% decrease in market share. However, the quarters 2,3 and 4 have seen growth in both sales and market share by an exponential amount. Overall however, the market share has gone down owing to the decreased popularity of the company.

The monthly sales do not show too much of a promising picture either. Months of July and October have seen a particularly decreased trend in sales but however the month of December has managed to buck up and increase it’s sales.

Force motors also stands out as one of the companies which have seen a favourable growth, however market share for this company is low amounting to a mere 0.97% in the 4th quarter of 2015. The sales on the other hand has increased by almost three times in the past year leading up to December 2015.

The monthly Analysis points to the months of April, August and November as the months of descent in sales while month like July and September show more than 20% increase in sales.

From less than 14 units sold, SML Isuzu has amazed us all with more than 303 units produced in the following year, last quarter. Each corresponding quarter has seen a huge increase in sales translating to the increase in market share of the company from a mere 0.01% in the first quarter of 2014 to 0.20% in the last quarter of 2015.

The monthly sales graphs show an erratic graph with both periods of increase and decline. A particular mention can be given to the months of September and May which formed the foundation for the base of increased sales of vehicles.

Isuzu motors has seen a definite decline in sales over each quarter. Overall, sales have dipped by 10% and so have the market share percentage figures.

The monthly sales show an uninteresting monotonous change in sales. However notable is the fact that may saw a 108% increase in sales from April of the year 2015.

Piaggio has also seen only negative changes in each quarter succumbing to a summative loss over the entire year. Sales had dropped by almost 20%. On the other hand, the market share was also dwindling down.

The monotony of the monthly sales of Piaggio was broken by the sudden decrease of more than 50% from July to August and immediately, a 114% increase in sales by the subsequent month. Apart from this, there have been no erratic behaviour in this graph.

Interview with Atul Singh Chandel, Director Autobei Consulting Group

The Hindu Newspaper: when the demand for trucks would see some real improvement, given the fact that the M & HCV growth is majorly being driven by replacement demand. It was also pointed out that there was a real possibility of some segments of trucks vanishing from the market in terms of volume. With the inclination of fleet operators towards heavy trucks, the demand for some segments might reduce or altogether be diminished.

Atul Chandel says that this is a normal trend that is observed across segments during the business cycle. As a result of deferring the replacement of the aging fleet, the pent-up demand arises. This demand is firstly satisfied, followed shortly by fleet expansion with the improvement of freight movement and rates. Also, with the festive season paving it's way through to the spotlight, new operators have joined the fray as business sentiments, clearing the path for new fleet addition. Though heavy trucks are becoming increasingly popular, this is a natural process. It is only natural for heavy payload trucks to be more in demand as the momentum of manufacturing and infrastructure projects increase. This is due to the easy drivability and more revenue and profit prospects of heavy payload trucks. A pattern emerges as we see the figures. First to be introduced was the 4×2, GVW 16T, the biggest truck, followed by the 6X4 25T GVW. Then 8X2 31T and 10 X4 31T were introduced keeping in mind more the payload, the better. There has been a translation from 25T to 31T gradually.  This shift in segments will mostly give rise to market dynamics and segment shirt. 16T is the most effective in the M&HCV segment, but has been constantly demoting due to the preference of 25T segment. Kerala and Goa still maintain 16T as the leading segment locally. This transition to the 16T segment translated as a de-growth whereas an astounding 90% was growth was achieved by the 31T segment.

The Hindu Newspaper: The current recovery phase witnesses the company Ashok Leyland to have gained more than its counterparts in the same in ensuring the country's growth in sales and share. What might have helped the company?

Atul Chandel: Similar to all other companies, Ashok Leyland also faced a sharp de-growth in sales. Smart tactics and market corrections has helped gain more profit. One of the major reasons for this is that Ashok Leyland is a self-financing company with self-captive finance. The company was also aided by it's aggressive sales strategy. The Medium duty truck BOSS grew up to about 15% in the corresponding segment in FY 15 and played a vital role in increasing its sales and market share. It grew to almost a double digit market shares within 3 months of it being launched in the respective states.

The Hindu Newspaper: Although BharatBenz had reported positive growth in the September quarter, their share in the M & HCV market dwindled down. In the following quarters, was it challenging to bring it's share and sales back up?

Atul Chandel: In spite of being a newcomer in the market, BharatBenz is one of the major performers in the Indian market. It has recorded a significant growth once in a month on it's truck sales. It is also a fact that volume wise, Bharat Benz is smaller than key players such as Tata and Ashok Leyland. Only the pioneers and the big players can impact this setup. Market share of Bharat Benz is not visible as the volume does not count much for the market share.

The Hindu Newspaper: Will this have a real challenge in boosting sales and shares in the coming years?

Atul Chandel: Only when BharatBenz's sales touch a limit, the market share becomes a parameter to the company. Once it reaches that level, Bharatbenz scales would be able to use market share to be a strong enough competitor.

The Hindu Newspaper: With new regulations and stress on profitability, how is the truck landscape changing the country? Do we see technologically-superior products getting accepted among the truckers?

Atul Chandel:Regulations are costly, and with the advent of a price truck, safety was improved and helped reduce the number of road accidents.  Technologically superior products are bought on a daily basis, however paced slowly. India is a price sensitive market. The key question to ask here is at what price do we want to adapt technologically advanced product. Not only India, this is true for almost all country. The only difference with India is that it is more significant among the developed countries. Technologically superior products are accepted easily compared to other segments for applications like mining, Tunnel operation, Oil industry, port and big infrastructure projects. Attractive ROI figures should be adapted to include latest technology in the certain time frame. However, it is still hard to sell trucks like Daimler Actros or MAN TGX series in India. These products are technologically advanced but the price tag is too high. Countries like Russia and China face the same problems too.