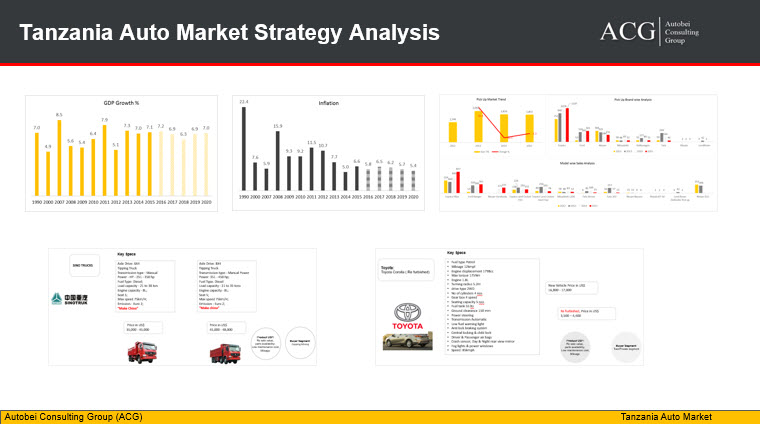
South Africa Economy is expected to register minor growth in next two years at 1.1% for 2017, and 1.8% for 2018. 0.3% GDP growth was noted in 2016 from 1.3% in 2015. Some of the key economic drivers are commodity prices performance, controlled inflation, and household consumption demand play key role but creating jobs and increasing per capita income are still challenge for the country.

South Africa is one of the most attractive markets for Global Automobile Industry. This is the biggest market in Africa region with two third of the regional market share. Most of the major OEMs is the presence with their latest product portfolio. There is enough space for all kind of vehicle like Premium, Budget, Used, Asian, European, and American brands.

The Auto Market in South Africa is dominated by local manufacturers product. 2016 was a difficult year for South Africa Auto Industry. Vehicle Export showed some growth only. The market will start to improve in 2018. The total market size of Car and the Commercial vehicle is 550,000 units in South Africa. In 2006, it was more than 700 thousand units.

South Africa’s market share of global new vehicle production dropped to 0.63% in 2016 low from 0.68% in 2015.

In the first quarter of 2017, the Auto market showed recovery but in the second quarter of 2017, the vehicle sales slide once again.

Highest car sales were in 2006 with 210 thousand unit and the GDP growth was 5.6% the same year.The data show a total of 97,824 units car sold in 2016 in South Africa, marking a decline of 13% year on year (y/y) from the 112,576 units sold in the same period a year before. Including export 336,370 unit cars sold in 2016 compared to 342,299 units in 2015. It is expected that due to improvement in market dynamics like the stability of interest rates, and positive movement in economic growth there will be minor growth in 2017. There could be some negative impact due to the volatility of exchange rates.

Light Commercial Vehicle also touched highest sales number in 2016 with 159,469 units. Total LCV sales in South Africa hit 130,364 units in 2016, marking a 7.5% decline from 140,790 units in 2015. By 2018, it is expected that market size will be 140,000 units.

While medium and heavy commercial vehicle (MCV) sales hit 26,997 units, down 11.40% y/y, sales hit 30,470 units.

Production Capacity:

The production capacity utilization of car was 76%, Light Commercial Vehicle 77.9%, Medium Commercial Vehicle 88.5%, and Heavy Commercial Vehicle around 80%.

Report Highlights:

  • What are the trends impacting the South African Auto Market?
  • Model and Brand Level Production Data – Trend and Forecast
  • Truck Analysis: Light, Medium, and Heavy Truck
  • Second-hand Truck Market
  • Bus Analysis
  • Passenger Car Analysis
  • OEMs Strategy Analysis
  • Price position
  • Network Analysis
  • Sales and Distribution Analysis
  • Segment wise Customer buying behavior
  • Product gap analysis
  • Brand position
  • Product position
  • Product life cycle
  • Market Share
  • Product analysis
  • Export & Import of vehicles
  • Demographic Analysis
  • Industry Analysis like construction, mining, and Logistic
  • SWOT Analysis
  • Risk and Opportunities Analysis
  • Company Business review
  • Product Strategy
  • Product Key Specs
  • Product USP

The report is available for Premium Subscriber also, If you are not the premium subscriber please contact to nidhi.singh@autobei.com

Mexico Commercial Vehicle Market Analysis. The Mexican economy is slowing with annual GDP growth of 2.3 percent in 2016, low from 2.6 percent in 2015. Rising oil prices and Slowdown in trade are few of the key challenges for the country. Low Inflation, private consumption, high wages, availability of jobs Jobs were few of drivers of the economy in 2016.

In 2017 also, we are expecting some challenges like political and Economy relation with US and North American Free Trade Agreement (NAFTA) issues.

Key highlights of the Report:

  • Brand and Model Level Production Trend and forecast
  • Sales Distribution from Mexico
  • Vehicle platform, Engine, Power, Transmission, Emission and more
  • Economic outlook and its impact on Mexico Auto Industry
  • Latest Development
  • SWOT Analysis
  • Automotive and Transport Industry Overview
  • Separate Vehicle Database of Truck and Bus segment
  • Application (Intercity & Intracity) of Buses statistics
  • Market shares and best-selling brands/models
  • Segments and top-selling models
  • Light vehicle market forecasts
  • M&HCV Truck segment Analysis
  • Price Position
  • Brand position
  • Industry Analysis
  • OEMs Strategy
  • Regulation

The report is available for Premium Subscriber also, If you are not the premium subscriber please contact to nidhi.singh@autobei.com

Kenya Automobile Market Analysis and Forecast is our detail model level report. Kenya is the largest Auto market in East Africa region. The GDP growth of the country was 5.9 percent in 2016 and expected to rise 6 percent in 2017. Key drivers of the growth are services sector performance, Construction activities, the Stable exchange rate of the currency, maintain low inflation, low fuel prices, a growing middle-class and its incomes, Govt investment in energy and transportation sector.

Markets in Africa region are generally faced with a high volume of refurbished vehicles which are considered low priced than new vehicles. New vehicles in Africa are predominantly imported as knocked-down kits and assembled in local facilities, whereas used vehicles are imported as fully built units.

In 2016, 110,000 cars were imported, marking an increase of 50% compared to 2015 in East Africa region. High-interest rate, Difficult to finance the vehicle, the high cost of electricity and Good quality of refurbished are few of the major challenges to sale in a new vehicle. It is expected that that total vehicle sales in East Africa will increase by 30 to 40 percent by 2022. Domestic vehicle sales drop by around 30% in 2016.We have exclusively sales data of some OEMs which do not share their sales data with local authorities.

Around 7 to 9 percent growth is expected in 2017 due to some favorable market dynamics for both Commercial and Passenger vehicles segment like financial, currency, Vehicle price, Govt policies etc.

In Vehicle type, Sedan and C segment is the most popular in Kenya.  Pick up is the largest segment in Passenger Vehicle. SUV/MUV is the second largest segment.

Mitsubishi and Isuzu are top players in the Truck segment. Chinese players like SinoTruck are also increasing their market share year on year. There is the significant price gap between Chinese and European and Japanese vehicles. Chinese new vehicle competes with used or refurbished European products.

Kenya became production and assembly hub for East African countries included major Indian and Chinese OEMs. Leading players like Toyota, Nissan and Mitsubishi already have plants in Kenya, mainly producing commercial vehicles rather than cars. Total production stands at about 10,000 units a year, according to the Kenya Vehicle Manufacturers Association (KVMA).

Vehicle price plays important role in Kenya market, Asian players are targeting this segment by offering low budget vehicles.  SinoTruk and Tata Motors are leading OEMs in Truck segment. These brands are positioned as reasonable and value-for-money products.

Volkswagen is having JV with Kenya Govt. VW plant is expected to start by end of 2017.The government has a 35 per cent stake in this JV. A number of companies with the assembly operation in Kenya – including Japan’s Toyota and General Motors – are also looking into applying for the incentives introduced by Govt. Volkswagen, Cherry, Renault, Toyota considered the country’s strategic position as a gateway to the East and Central African regions.

Under the new duty structure, Govt is promoting locally manufacture practice. CKD kits are waived from the 25% import duty and 20% excise levy that applicable on fully built imports vehicles. Under this tax system Excise Duty Act of 2015 local assemble vehicle will be available at competitive price. Govt imposed some additional tax on new vehicles and more than 3-year-old vehicle in 2016 which had a negative impact on Auto Industry. After pressure from many Industry stake holders of Auto Industry, this additional tax was removed. Due to additional tax, prices of pick-ups, buses and trucks increased by between Sh231,000 and Sh1.2 million.

Key Highlights of the report:

  • Market Overview and Latest development
  • Product pricing Analysis of New used and Refurbished vehicle
  • Truck, Bus and Passenger Vehicle Included in report
  • Trend and Forecast 2023
  • Brand Position
  • Customer behaviour
  • Customer Segments
  • Vehicle Uses/Application
  • Sub Segment Analysis
  • Macro Economy Analysis and Forecast
  • Product Position of Indian, Chinese, European, Japanese and American brands

The report is available for Premium Subscriber also, If you are not the premium subscriber please contact to nidhi.singh@autobei.com

US Commercial Vehicle Production forecast is our exclusive Brand and Model level Data. Data contain separate data for truck and Bus segment.

Key Highlights of the Report: Truck and Bus Segment

  • Key Macro Economy Trend and Forecast
  • Truck and Bus Volume Outlook
  • The Model level Sales and Production Data is available separately.
  • Market Size – Production and Sales
  • Model wise and Brand wise Market Share
  • Market Trend and Forecast 2000 to 2022
  • Product Specs
  • Competition Analysis
  • Light, Medium, Semi Heavy and Heavy Truck Segment
  • Truck and Bus Product SOP and EOP
  • Product Age Analysis
  • Product Sales Distributor region wise
  • Product lifecycle rating
  • GVWR and Bus wise Application wise
  • Engine Manufacturer Technical detail
  • Engine Sales and Production
  • Engine Specs and other technical detail
  • Emission norms Detail
  • Horsepower (hp) – Model and Engine wise
  • Production plant
  • Sales Distributors
  • Product platform
  • Product design
  • Valve Detail
  • Cylinder information

The report is available for Premium Subscriber also, If you are not the premium subscriber please contact to nidhi.singh@autobei.com

Indian Automobile Industry Analysis Q1 FY 2018 is a historical quarter for every segment of Industry. GST implementation changed complete business process of Industry. We have also seen recently the impact of Demonetization on the economy. ACG is expecting that RBI will change its repo rate which will also have a positive impact on all key Industry.

We have revised the Sales, Production and Export forecast after changing the market dynamics.

Our detail Quarter wise report included:

  • Automobile Industry Trend and Forecast
  • Macro Economy changes and its expected impact on Next quarters
  • Key finding of Market and latest development
  • Passenger Vehicle, Commercial Vehicle, Truck, Bus, Two Wheeler and Three Wheeler
  • Prices changes after BS IV and GST implementation
  • Market Share
  • Product and Price Analysis
  • OEMs Strategy Analysis
  • OEMs Sales, Production and Export Analysis
  • Model Level Production Forecast
  • Retail Finance

The report is available for Premium Subscriber also, If you are not the premium subscriber please contact to nidhi.singh@autobei.com

Russia is one of the key markets for Commercial Vehicle. Like China and India, this market is also dominated by local players.

Russia — one of the world’s largest oil producers is facing depreciating Rouble currency. High-interest rates and lowered oil prices are affecting the country’s economic growth.

After recession ended last year, the economic growth continues to be weak. GDP kept contracting for seven quarters before growing at 0.3% in the last 3 quarters of 2016 leading to an annual gain of 0.5% in the last quarter. This year it might expand to a net gain of 1.5%.

The makers and suppliers of commercial vehicles, trailers and bodies can also gauge the tangible effects of the political and economic crisis. For example, the decline in demand for food and other investment on consumer’s goods from Europe led to a decline in the volume of freight in Russia which in turn led to a decline in demand for motor vehicles required to transport this freight. This thus affects the demand for commercial vehicles and trailers that are needed to transport this freight.

Russian government raised auto support to 64.1 billion roubles from 50 billion in 2016.

In Russia, the market for heavy commercial vehicles over 6 tons, grew rapidly over the years after the crisis of 2008 and 2009. In 2012 it came to a good 134,000 units – its highest volume ever. However, since then the market kept contracting rapidly. In 2013, new registrations fell by 22% to 105,000 while in 2014 it fell to 81,000 losing another 23%.

In 2009, market touched bottom with 131 thousand units. Commercial Vehicle started to show recovery sign from 2016. It clocked in 4 percent overall growth in CV segment. ACG is expecting that market will continue with single digit growth at least for the next 2 years.

Around 60% of the total market dominated by LCV segment, Heavy trucks generate 23% of the market and 6.6% of the sales belongs to Bus segment.

In 2016, Heavy Truck production segment registered a staggering growth of 11% while Heavy Bus production segment clocked in 50.6% growth compared to 2015.

But the local production, which expanded strongly in recent years, has collapsed since 2014. In some cases, the plants of German commercial vehicle companies are producing at a low level.

In 2017 LCV and Car segment also started to show double digit growth.

GAZ and Kamaz are market leaders in LCV and HCV segment. Kamaz is the market leader in heavy duty truck. After having JV with Daimler, Kamaz introduced new vehicle series for budget segment truck. Recently both companies are working to create and developed new product portfolio with new cabin and Engine by investing 100 billion rubles in next 5 years.

Chinese Truck manufacturers also trying to get more market share by launching new products in the Mass market like Foton introduced new generation product in light duty truck with Cummins engine. GAZ group launched special truck for Oil and Gas segment. This segment is back bone of country economy.

In Premium Truck segment Volvo, Scania, and Mercedes Benz are top three players in Russia.

After Russia became a member of WTO, foreign brands are increasing their market share in the Russian Auto Sector due to new market dynamics of Industry.

Along with neighboring CIS countries, Vietnam, Cuba, countries in Latin America and Africa are also important markets for export. Meeting local product specs, regulation and technology are the key challenges in export.

Report Highlights:

  • Truck and Bus market Overview
  • Market and Product Comparison among European, Chinese and Russian Brands
  • Model Level Truck and Bus Production Trend and Forecast
  • Vehicle Technical Detail
  • Sales Distribution
  • Market Size
  • Pricing Analysis
  • Brand and Product position
  • Competitor Analysis
  • New Product launch
  • Top Models in Truck and Bus segment
  • Sales, Production and Export Data
  • Industry Analysis – Construction, Oil, Mining, Logistic etc
  • After Sales Analysis
  • Country Economy Analysis and Outlook

Thailand Commercial Vehicle Market Analysis and Forecast is our exclusive detail report on Truck and Bus segment. Thailand became the key Automotive hub in South East Asia region. This is 8th largest Commercial Vehicle market as per 2016 statistics. The market size in 2012 was around 763 thousand units and in 2016 it is just 440 thousand.In 2009, it touched the bottom of 318 thousand unit because of low market sentiments. Slower economic growth, poor crop prices, Flood were few of the major challenges for Industry in last 5 years. The buyers’ incentive program helped the Industry for short time duration only.

GDP grew by less than 2.5 percent a year in 2016 and 2014. It is expected that in 2017, country GDP growth to pick-up around 3.1 percent. Private consumption and public investments are the key drivers of growth. Govt shall focus on Infrastructure development and promote manufacturing by introducing latest and upgraded technology to boost Auto Sector.  The manufacturing sector contributes 15 percent of the employment and contributes 35 percent of GDP.

Thailand’s cabinet approved an infrastructure plan for 2017 worth Bt895.8bn (US$25bn) in December 2016. The plan included 36 transport infrastructure projects mainly rail, road, air, seaports. Loans, with the remainder from the government budget, public-private partnerships (PPPs) and an infrastructure fund are the key sources for the Bt576bn fund.

In our detail report, we have covered both Truck and Bus segment:

  • Country Overview
  • Macro Economy
  • Latest Development
  • Key Points
  • SWOT Analysis
  • Model Level Sales and Production Data Trend and Outlook
  • Market Share Analysis – Model and Brand level
  • Key Technical detail of each model of Truck and Bus
  • Competitive Analysis
  • Industry Drivers
  • Other key vehicle details are also included like Engine, Transmission, Clutch, GVW, Production Brand, Sales distribution etc

Get Premium Subscription for unlimited reports and Data, COntact to Info@autobei.com

Brazil Commercial Vehicle Market Forecast 2023 is our exclusive report. Brazil’s economy is facing a tough time. The country’s GDP is continuously falling from the last couple of years. The political crisis is also one of the reasons for this recession.

In 2012 the country registered 3.80 million new vehicles and in 2016 it registered only 2.05 million, which is a notable gap. In 2015, Commercial Vehicle sales registered 49 percent degrowth compared to 2014 and in 2016 it registered 34 percent growth compared to 2015. In 2017 also the market would have a similar trend. We are expecting that the market will start to show a 1 percent growth from 2018.

Currently, OEMs are using less than 50 percent of their production capacity and in the case of Heavy Commercial Vehicle, it is around 75 percent. Vehicle export to neighboring countries like Argentina, Colombia, Mexico, Peru, and Uruguay could give a boost to production and also utilize maximum plant capacity. Argentina, the European Union, the USA, and Mexico are major export countries.

The construction and agricultural Industry also started to show some positive sentiments. Fleet owners started to renew their fleet which will have a positive impact in 2018.

Economic regulations and financing a new vehicle are a few of the challenges for the market.

Brazil is one of the top markets globally for commercial vehicle and it is the single largest market in Latin America. ACG is having exclusive Model-level Truck and Bus production data with its trend and forecast for 2023.

Our exclusive vehicle production data is helpful for Business Planning, Strategy making, Competitive Analysis, Auto Components production planning and forecast for OEMs.

Tanzania Auto Industry Auto Industry Analysis and Outlook is a detail report. It is part of East Africa Auto Industry Analysis. Tanzania maintained steady, high growth over the last period around 6%–7% per annum. The inflation rate is under control of around 5 percent and poverty rate declined.

Tanzania Auto Market Strategy Analysis and Forecast

Tanzania’s economy with its ever-growing middle class is powering a growing and impactful Regional Auto industry. New products, OEM strategy, Assembly units and an old manufacturer returning, are reshaping Tanzania’s Auto Industry. An East African market is having huge potential for Auto Industry. Tanzania is one of the key markets in East Africa region.

In 2016 the Passenger vehicle segment showed 19 percent degrowth and even the Truck segment showed de-growth. However, the bus segment registered some positive growth.

The market is divided into New, Refurbished and Used vehicle. To increase the market share of new vehicle sales, OEMs are looking into options to assemble vehicle parts locally or import from Assembly in Kenya and another neighboring country. This step also avoids the import duty on a new vehicle.

Pick up segment is the largest segment in Tanzania with more than 60 percent market share, followed by SUV with more than 30 percent. Car and Van make up 2 and 1 percent respectively of Tanzania’s Auto Industry.

Hatchback, Saloon and Station wagons are major body type vehicles in Tanzania. B and C type vehicles are more popular segment since it is price sensitive market.

In SUV segment, Toyota, Land Rover, and Nissan are major players. In SUV segment, C and D body types are dominating vehicles. Van’s market is stagnant and Maruti is the market leader.

The price of the one of the refurbished SUV model is around 12,000 US$ and brand-new vehicle price is 24,000 US$. We have covered prices of all key models of all segment in our detail report.

The Chinese OEMs are also trying to crack SUV segment fast, to have a significant presence in East Africa.

In Pickup segment, Toyota, Ford, and Nissan are major players. Toyota Hilux is the market leader in this segment.

The standard warranty on these vehicles is 3 years or 100,000 Kms whichever occurs first.

Investment in Infrastructure development and steady growth in agriculture and transportation are the main key drivers of the Cargo Vehicle segment. Road transport is the major transport segment because rail network is inefficient. For all major goods, transportation Cargo vehicle (CV) is mainly used.

Heavy Duty Truck is the largest segment in Commercial Vehicle segment. Chinese OEMs are dominating the market due to its price positioning and cordial ties in Afro-Chinese Political & Economic relationships. There is a quantum difference between the market prices of Chinese and any another foreign brand.

Chinese automobile brands improved their brand positioning in the last couple of years. Sino Truk, Foton, and Dongfeng are few major Chinese brands in this segment.  Most of the Chinese brands offer customized vehicles which suit the market dynamics of the country of Tanzania. For example, they install heavy engines and bigger fuel tanks which suit long distance movement of vehicles. Their new Chinese vehicle price is almost half compared to the new vehicle price.

Volvo and Scania are popular brands in the refurbished Truck segment. Scania buses are also popular in luxury bus segment.

Tata is the market leader in Medium Duty Truck segment while Mitsubishi is the market leader in Light Duty Truck segment.

Eicher, Kinglong, and Tata are major players in Bus Segment.

The important buying criteria for Truck purchase are the mileage it offers, Low maintenance cost, and its resale value.

For marketing and brand awareness the most effective promotional media are Bill Board ads, Auto magazine, and Trade Fairs.

Report Highlights:

  • Industry Overview
  • Commercial Vehicle and Passenger Vehicle Sales Trend and Forecast
  • Market Drivers
  • Market Challenges and recent development
  • Model Level Analysis of Passenger, Truck and Bus segment
  • Product Analysis – Price, USP, buyer segment, Technical Specs and Position
  • Brand position and perception
  • Detail Sub-segment Analysis

Japan Truck and Bus brand and model level Production forecast available from 2000 to 2023. It is exclusive data along with the Technical detail of Models

Such data is useful for Business Strategy, Production planning, Competitor Analysis, Product Analysis, Product life cycle, Medium and Long term planning. This exclusive data could play the key role for OEMs and Vendors future planning.

We have covered following information in our database:

  • Brand
  • Model Level
  • Start and End of Production
  • Production plant
  • Assembly type
  • Platform
  • Program
  • Segment
  • Emission norms
  • SOP
  • Valves
  • Cylinder
  • Power
  • Torque
  • Cylinder Block Material
  • Displacement
  • By Fuel type
  • By GVW
  • Architect
  • Design

ACG subscription option gives unlimited data and report access

ACG Intelligence service released latest Two Wheeler Strategy Analysis and Forecast 2030 report with revised forecast of Model level Sales, Production, and Export.

Get Exclusive unlimited Research reports by taking our Subscription package.

Two Wheeler Strategy Analysis FY 2017 and Forecast 2023

Key Highlights of the report:

  • Price bracket segment and Model share
  • Sales and Production Forecast 2030
  • Customer mapping with Product Price & Features
  • Market Size in terms of Volume and Value
  • Economy, Executive, and Premium Bike
  • Top Models and their USP
  • New Model launch and impact on segment
  • Brand and Model level Sales & Production Trend
  • New OEMs Strategy to enter into new segment and create new scenario of competition
  • Product life cycle Analysis
  • Brand Analysis
  • Advertising Strategy
  • Product planning forecast
  • Market Drivers
  • Opportunities and Challenges
  • Demographic segmentation of two wheeler
  • Horsepower wise Product Sales  Analysis, Trend, and Forecast

Indian Tractor Trailer Strategy Analysis and Forecast is our exclusive detail report. Indian Tractor Trailer market is flourishing in India. It has a registered impressive growth in last 3 years. This segment will gain quantum advantages of GST implementation and this is one of the biggest fiscal reforms since independence. It is the right time to enter into the Tractor business or launch new product/ Update existing product portfolio. The segment is divided into Low cost, Budget, and Premium segment.

(Subscription our Annual service package and get unlimited exclusive reports)

From 2013 to 2017, the CAGR of the segment was 27.9 percent and now, it is expected to 7.9 percent by 2023.

The market size has become more than double in last 10 years. The market size was around 25,000 units in FY 2008 and it is 53,000 units in FY 2017.

Indian Tractor Trailer Market Trend and Forecast

Tata Motors and Ashok Leyland are having an almost equal market share, however, Ashok Leyland gained 19.5 percent market share and on the other hand, Tata Motors lost 22.8 percent, Mahindra and Eicher gained 3.3 percent, Volvo and AMW lost 0.1 percent and 2 percent market share.

There is nothing called good or bad tractor, but it all depends on its application. The Tractor is suitable for many long-distance loads carrying, special application and heavy loads transportation. Some of the Applications are Agriculture, ODC, Space, Defence, Vehicle transportation, Gas, Machinery high-density material, coal, Construction Material, Machinery, Steel, Container, Bulker, ODC, Marbles, Tanker etc.

Every state is having different market dynamics, Market Size, Growth Driver, Opportunities, and Challenges. Our full report covered a very critical analysis of this segment.

It covers the long distance, after-sales, Driver comfort, Safety features, Cabin size, Mileage, payload, and Speed plays a vital role.

The market trend is moving from low cost to Budget segment, most of the products already moved but the premium segment is stagnant.

Mahindra Blazo performance is an excellent and its mileage challenge looks work to gain customers confidence. Mileage is one of the most important criteria for tractor vehicle. The Tractor sales increased from 500 units to 3,075 units in FY 2017.

Mahindra Truck Sales Analysis

Mahindra Product and Sales Analysis:

Mahindra Product and Competitor Analysis

On our detail report, we have analyzed what are the reasons for this market share fluctuation.

We have analyzed in brief that the great impact of GST is overloading banned, improve road infrastructure, logistic sector growth, Elimination of the checkpoint, Lower turnaround time, Expected changes in Supply chain changes, E-way bills, Fleet Utilization etc.